
Run and Filter a Report
Change the range first, then the entities, then the columns, then export.
Last reviewed
Doing it in that order avoids re-fetching a large result twice and avoids the most common reason two people get different answers from the same report.
Highlights of running a report
- The toolbar sits above the result, so everything that changes the answer is visible while you read it.
- The toolbar is not the same on every report. Sales by Customer carries Entities, Account Transactions carries Group, Journal Report carries neither.
- Run Report re-fetches; changing a filter does not, until you ask for it.
- Compare puts a second period beside the first in the same table.
- Fifty-six columns are available on a report like Sales by Customer, and four are shown by default.
- Every setting is on the report, not in preferences, so nothing you do here changes what a colleague sees.
The filter bar
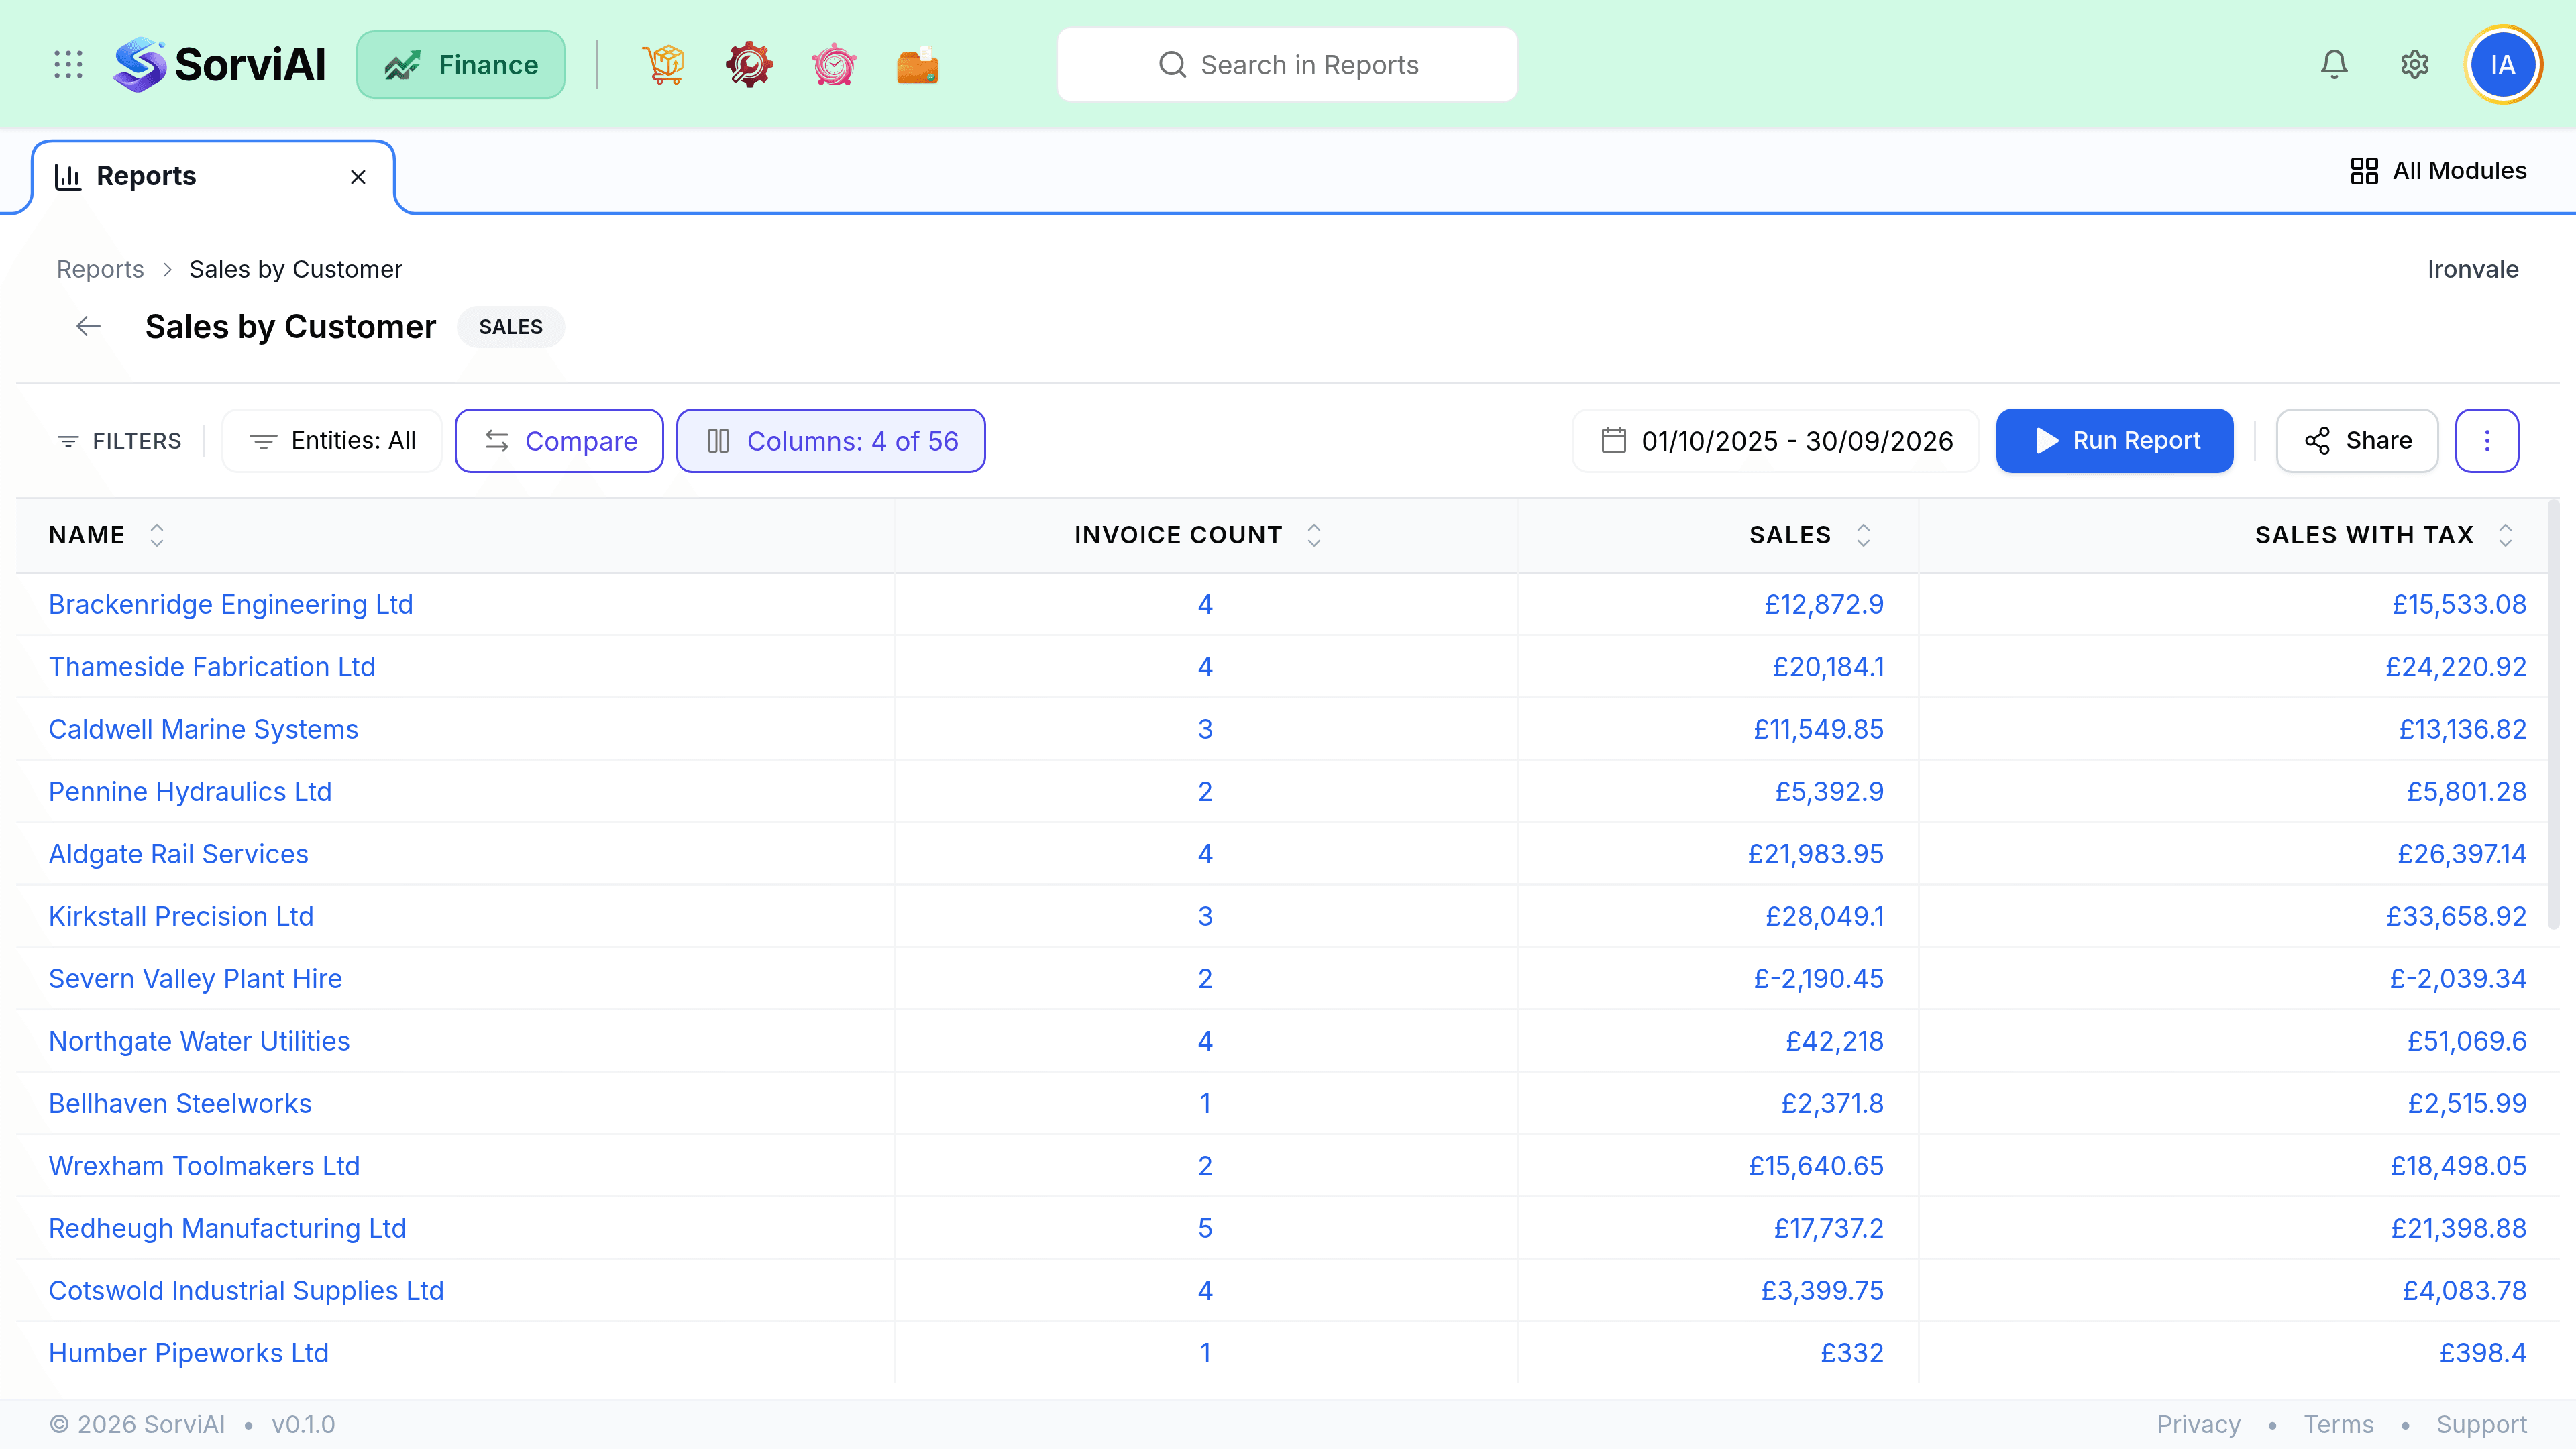
Every report opens on a sensible default period, usually the current financial year to date. Three controls change the answer, and everything else changes only the presentation.
- Date range is the single most common cause of a report disagreeing with a dashboard tile.
- Entities decides which documents are counted at all.
- Comparison periods put last year beside this year in the same table.
Entities
Entities opens Filter entities, a short list of the document types the report can read: Invoice, Credit Note and Journal, with Apply and Cancel beneath. Untick one and its documents stop being counted, which changes the total rather than the layout. This is the only control in the toolbar that removes rows.
Comparing two periods
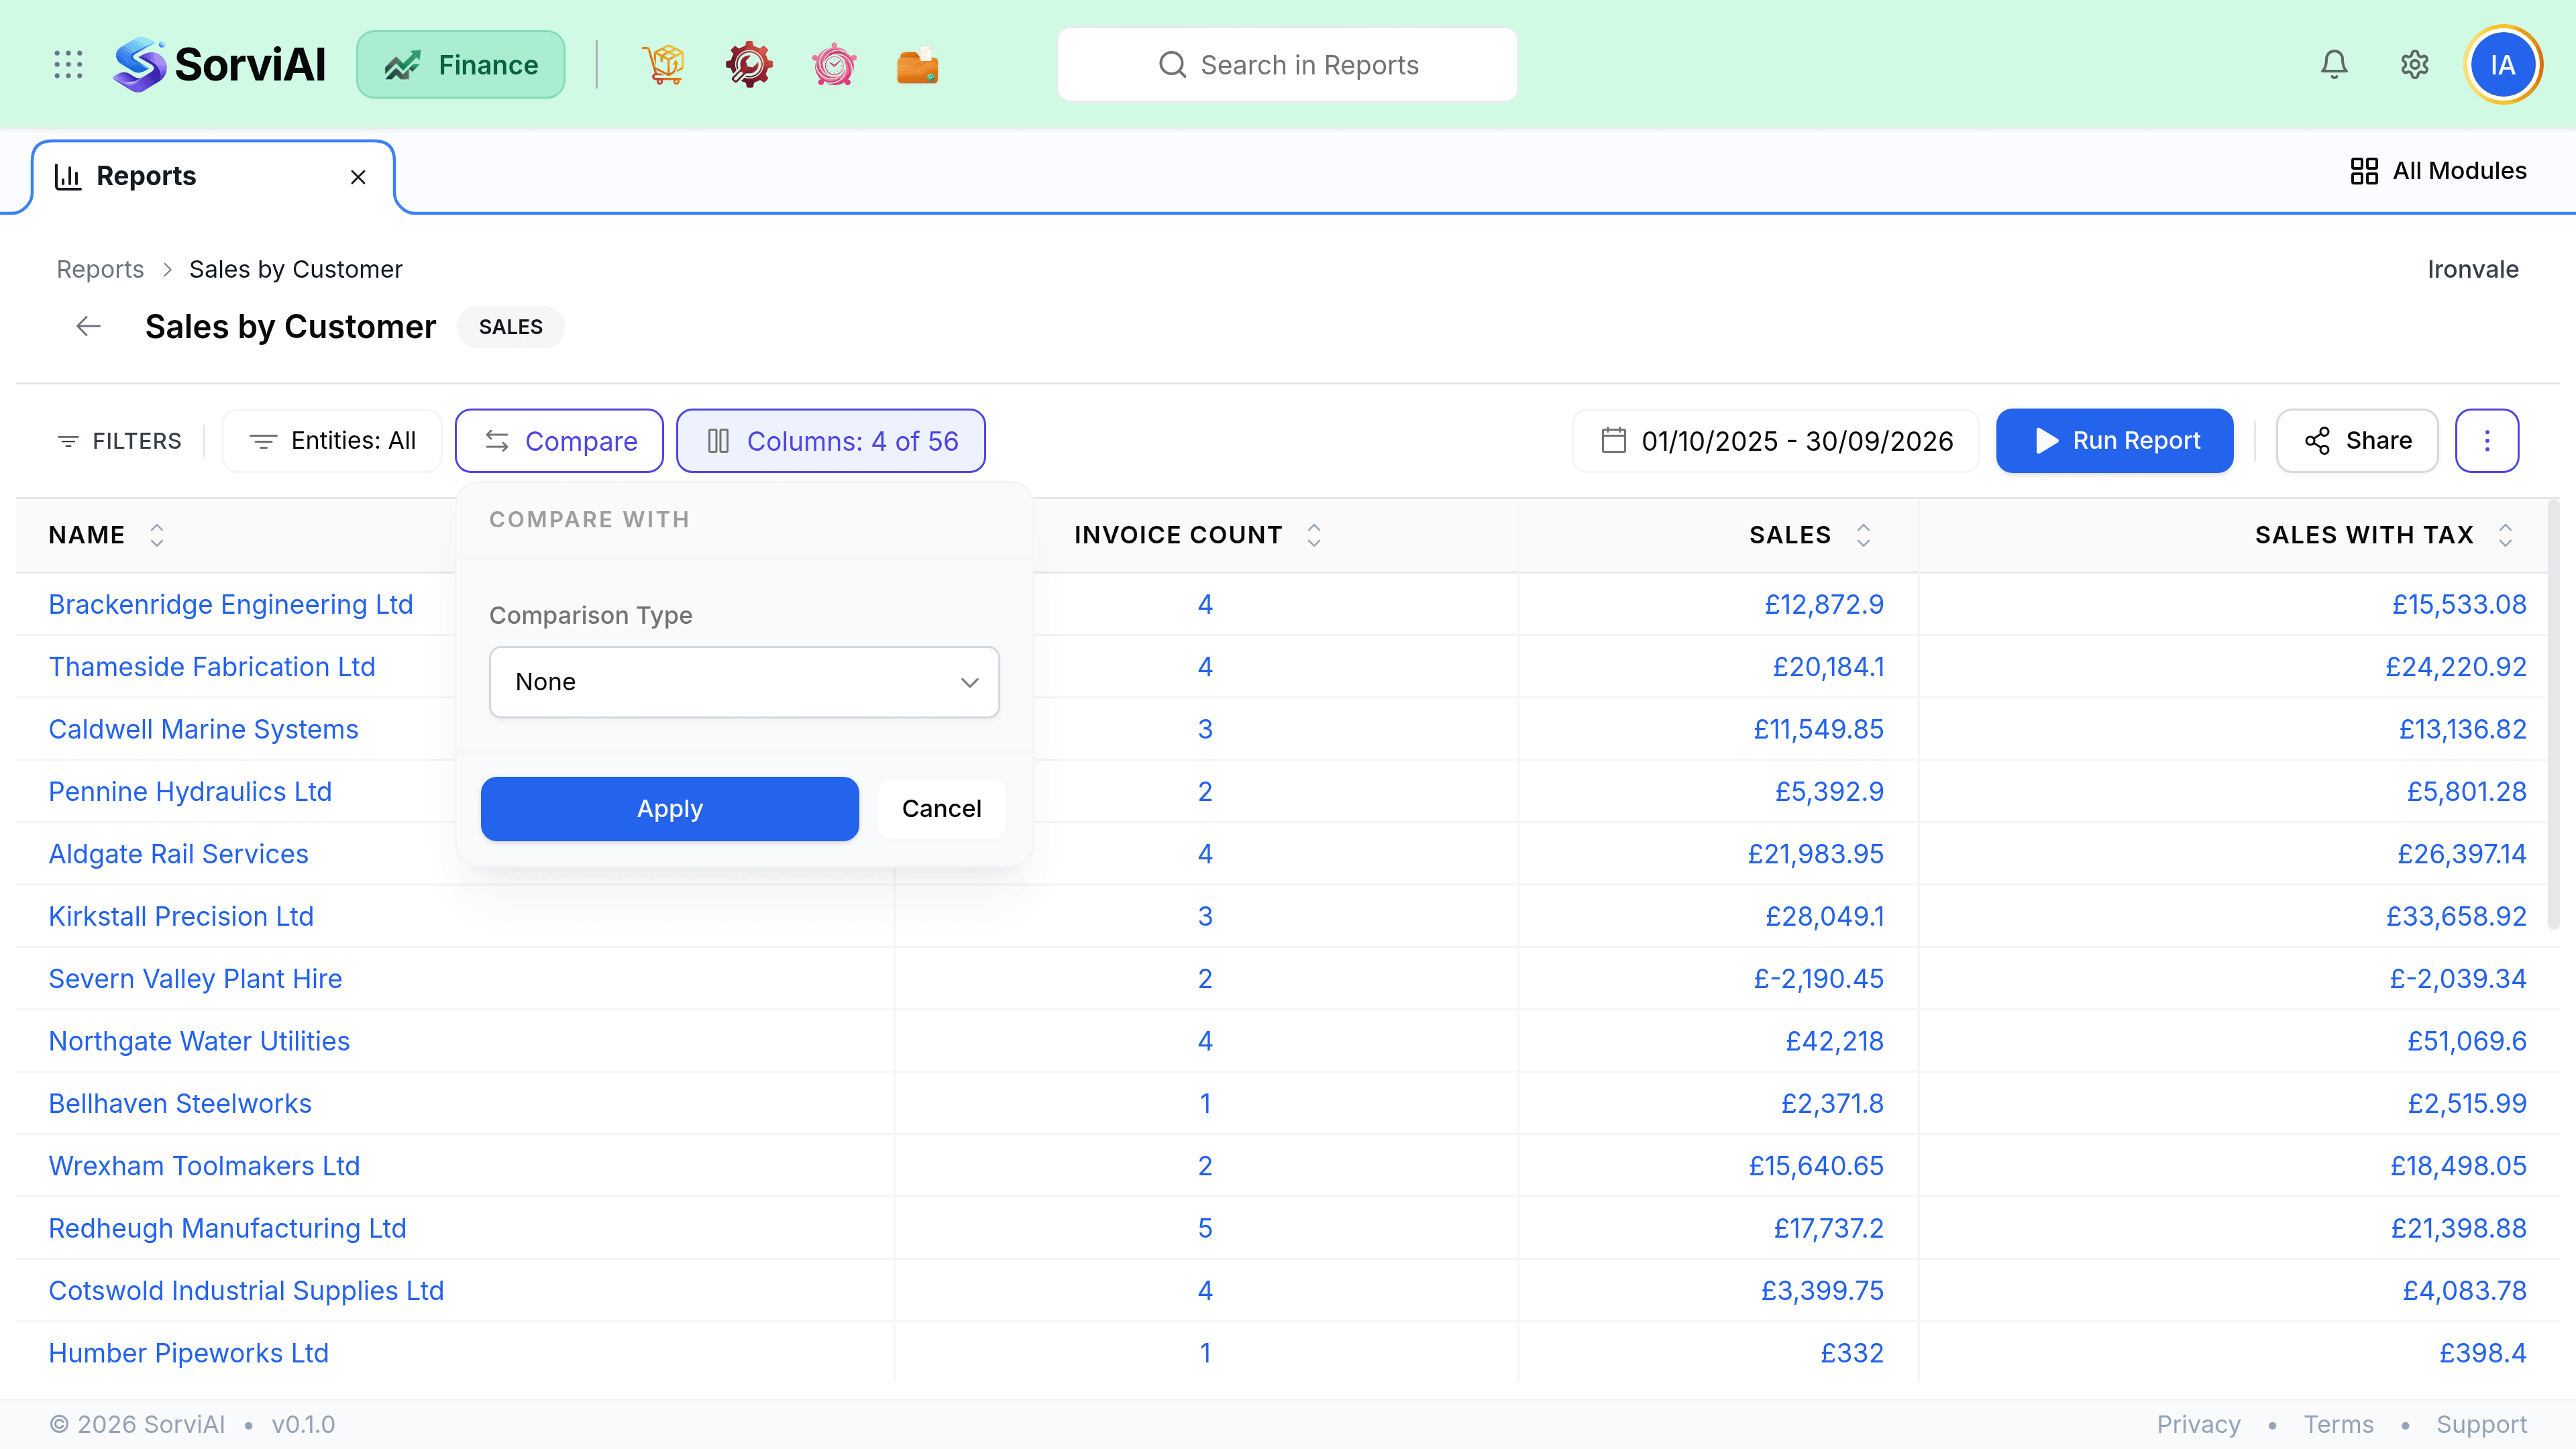
Compare opens a small panel under its own button in the filter row. Pick a comparison type and apply it, and the table gains a second set of figures beside the first.
Choosing the columns
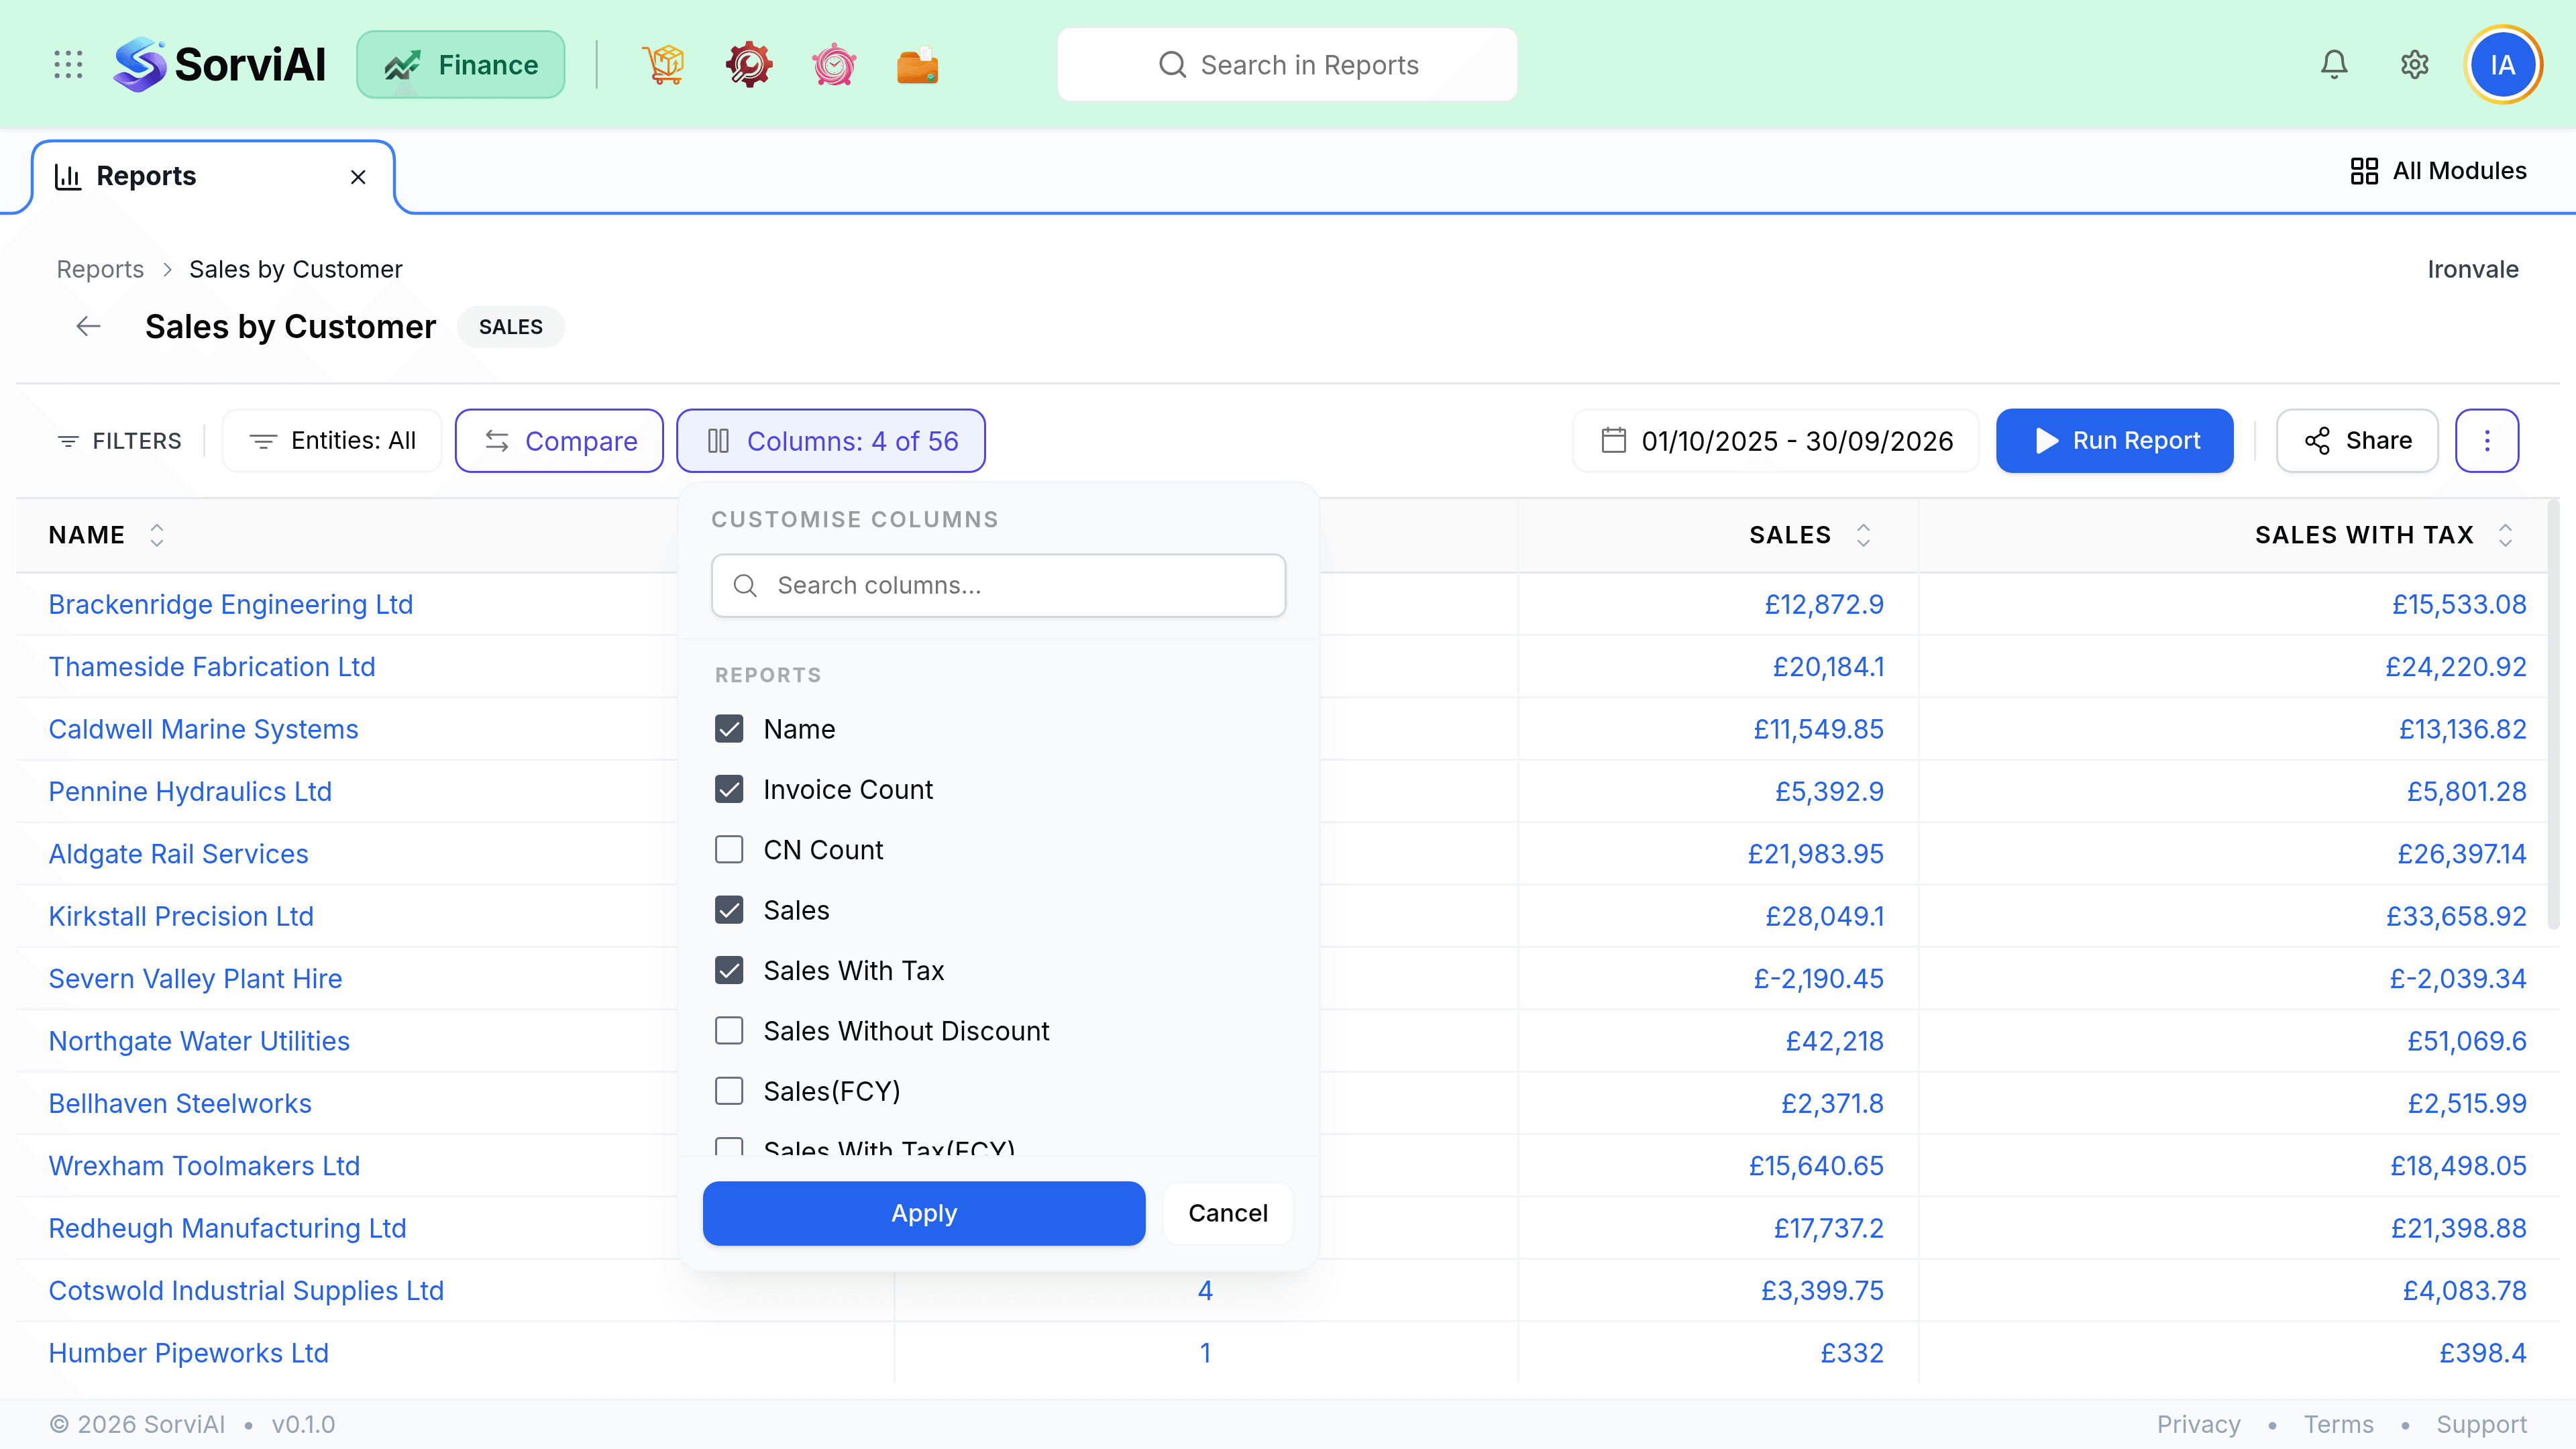
Columns opens a checklist under its own button: every column the report can carry, with the ones currently shown already ticked. Tick to add, untick to remove, then Apply.
Filters and columns together
Filters narrow the rows; columns decide what is shown about them. Set both before exporting, because the export honours exactly what is on screen and trimming a spreadsheet afterwards is slower than trimming the report.
- Grouping by account, customer or item changes the shape of the report rather than its total.
- Filters persist while you stay on the report and reset when you leave it.
- The toolbar carries whichever of Entities, Group, Compare and Columns the report supports, beside the date range.