
The Leave Report
Utilisation across a year, broken down by department and by leave type.
One report covers leave, and it is the only one that opens on a whole calendar year rather than a month. Leave is an annual entitlement, so a monthly window would say almost nothing.
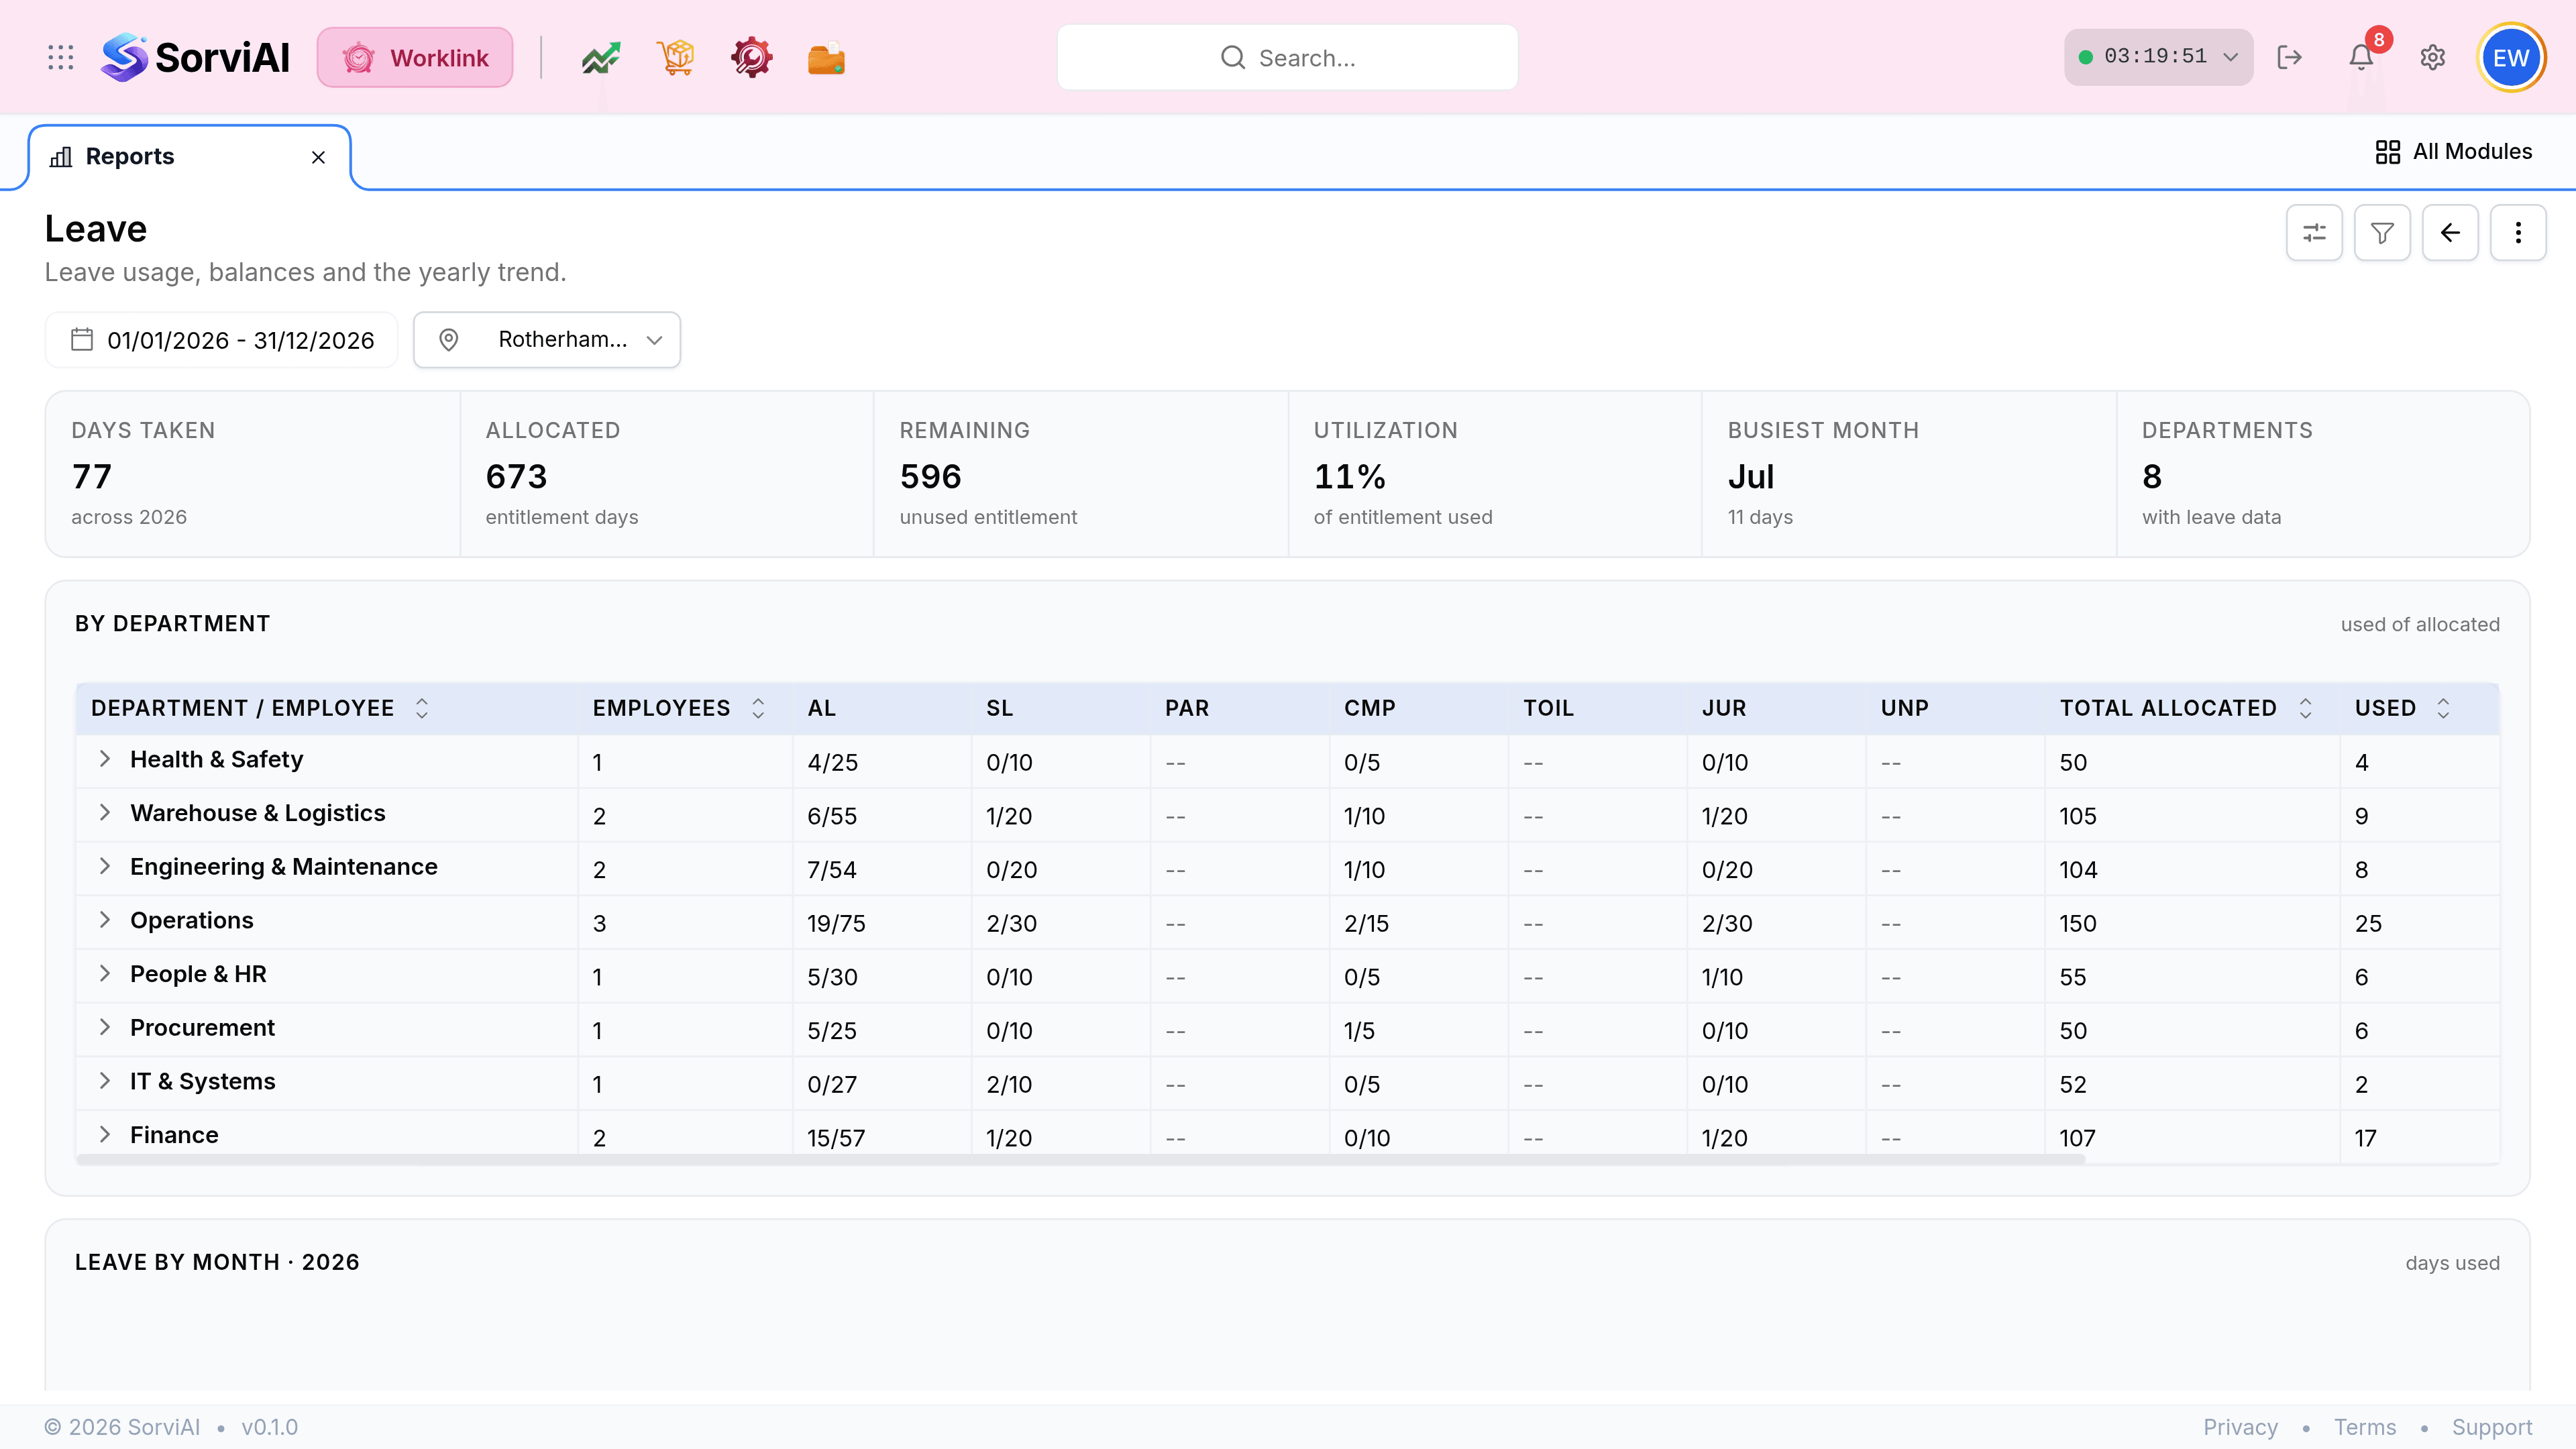
The six tiles

| Field | What it does |
|---|---|
| Days Taken | Approved leave days used in the period, across everybody at the depot. |
| Allocated | Total entitlement days granted by the leave policies that apply, added across every employee and type. |
| Remaining | Allocated less taken. Unused entitlement, most of which will not carry into next year. |
| Utilization | Days taken as a percentage of allocated. The single number the report exists to produce. |
| Busiest Month | The month with the most days taken, and how many. Useful for spotting a cover problem before it repeats. |
| Departments | How many departments have any leave data in the period. |
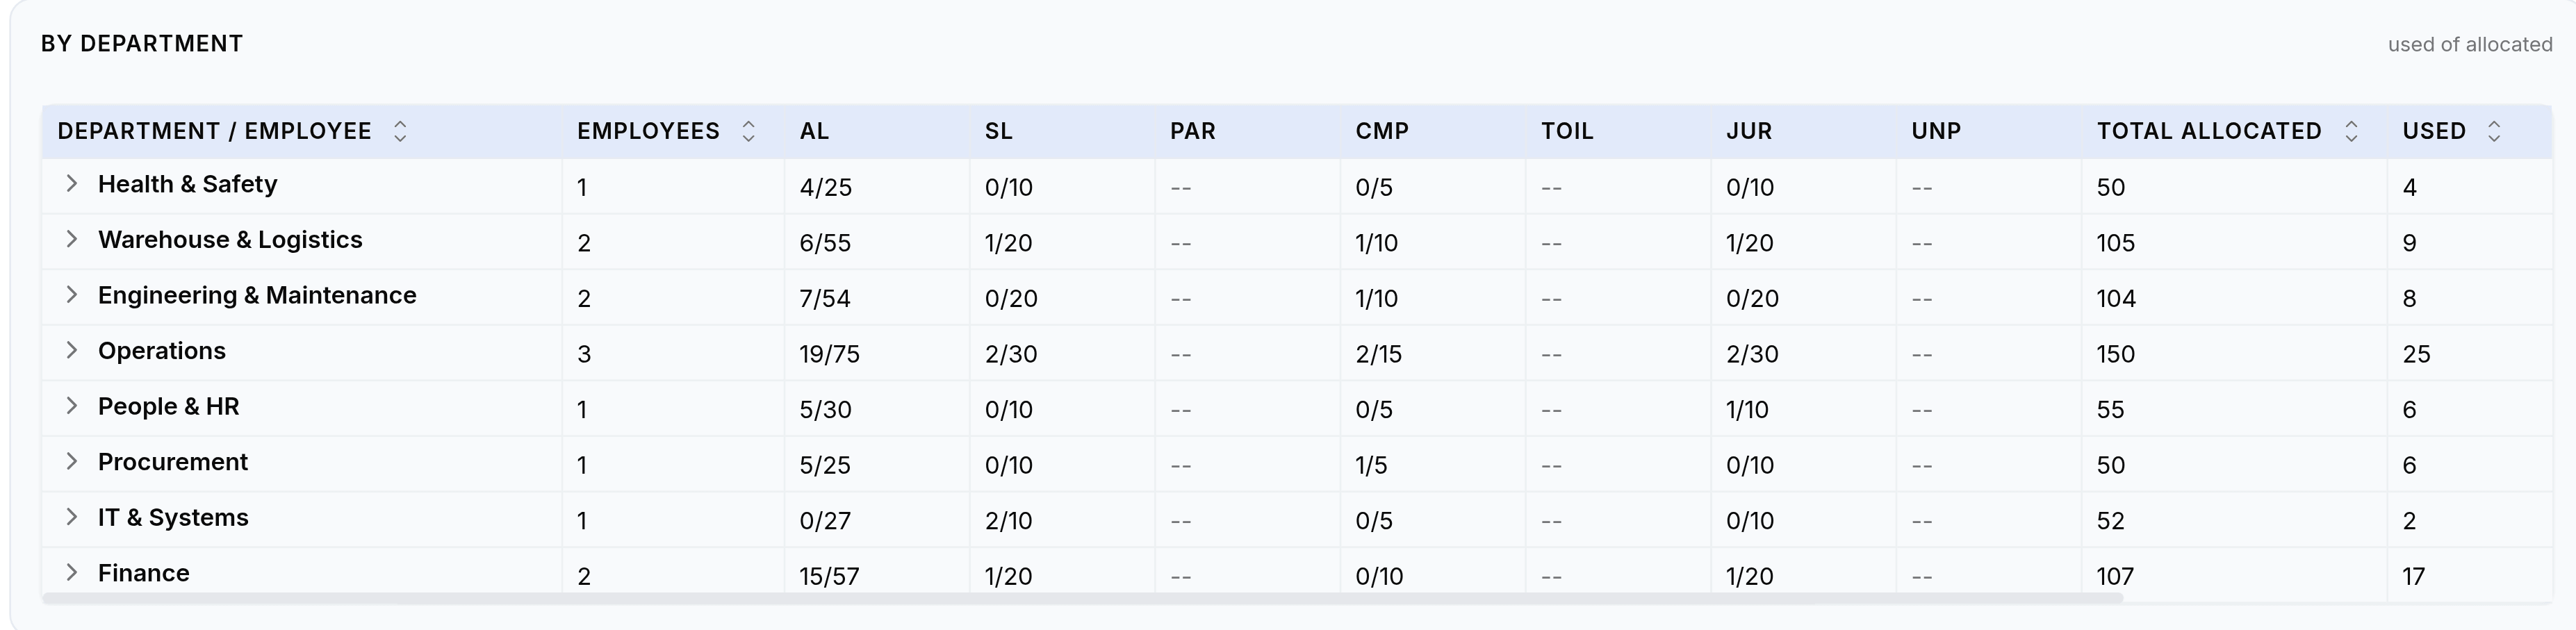
By department, by leave type
Leave by month
The chart under the table plots days used per month across the year. It is what turns the Busiest Month tile into something actionable: a single spike is a shutdown, a rising curve towards December is everybody using entitlement before it expires.