Skip to the article

The Attendance Reports

Employee Report and Attendance, what each figure counts, and the qualifiers printed beside them.

Two reports cover attendance: one across everybody, one down into a single person. They share a definition of attendance rate, and the screen prints it rather than leaving you to guess.

Attendance, across the company

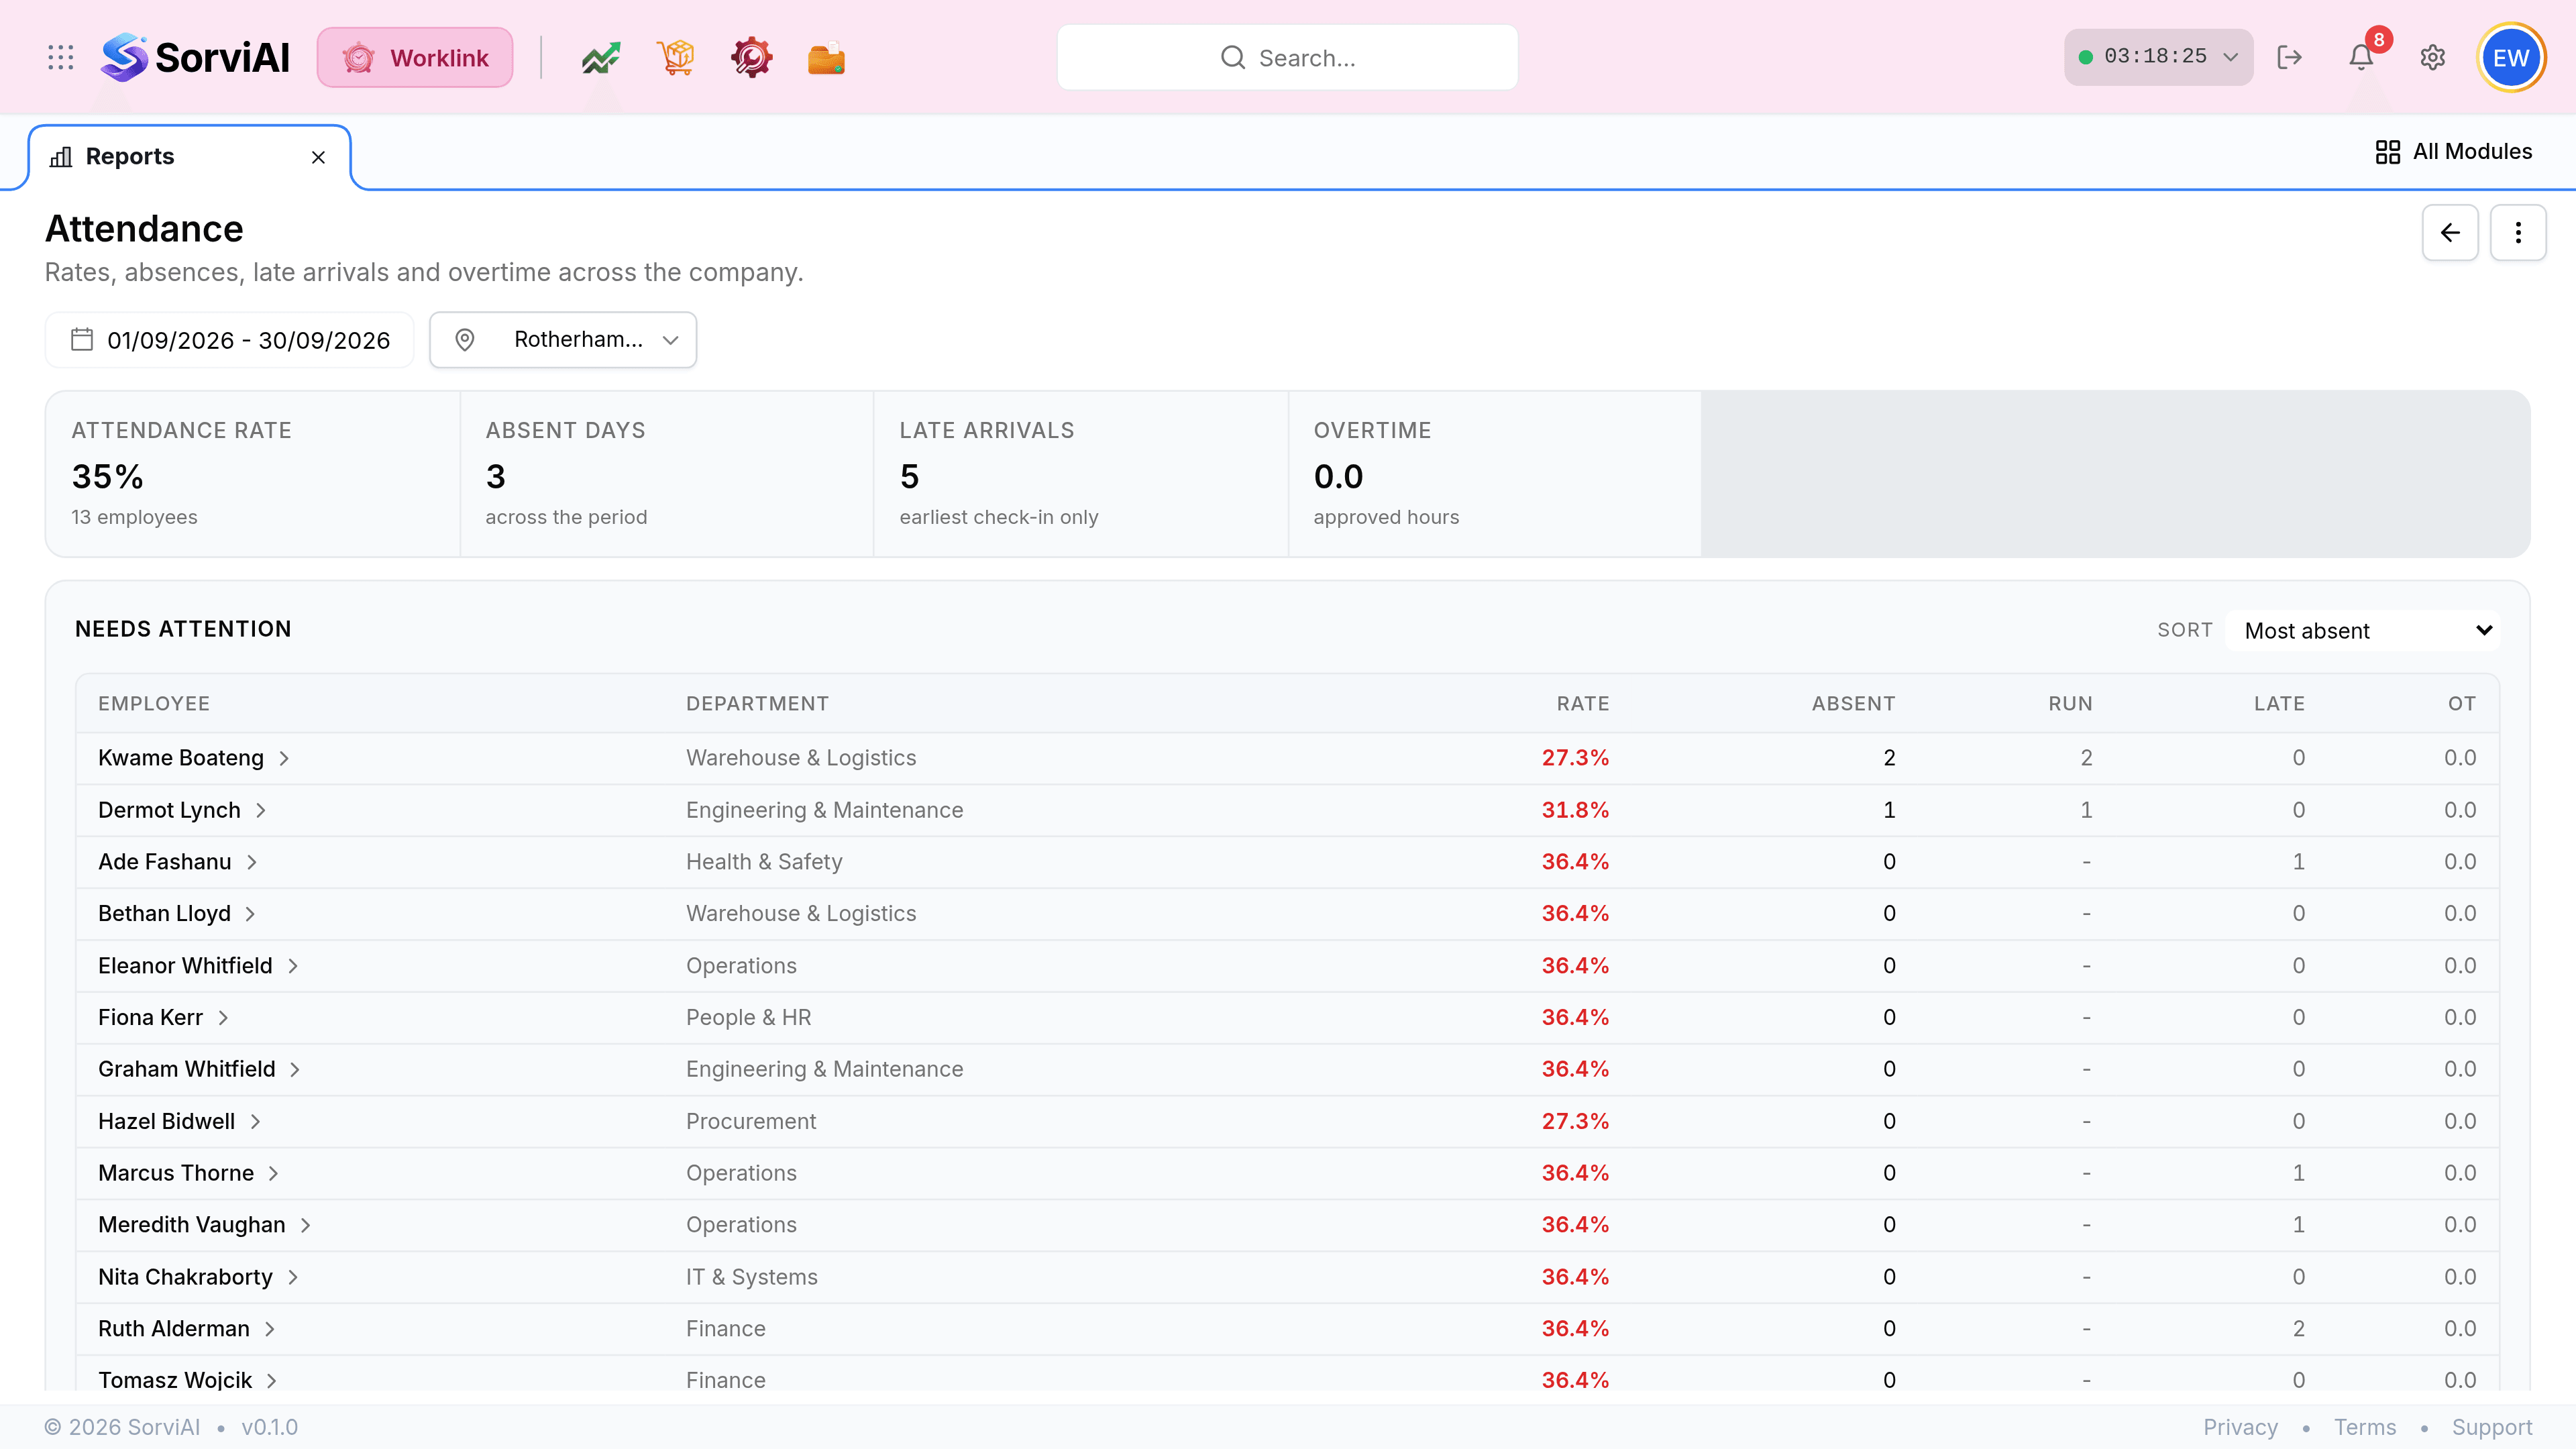
The Attendance report, headed Attendance above the line Rates, absences, late arrivals and overtime across the company, with a date range of 01/09/2026 to 30/09/2026 and a Rotherham Central Warehouse location picker. Four tiles read Attendance Rate 27 per cent for 13 employees, Absent Days 0 across the period, Late Arrivals 5 earliest check-in only, and Overtime 0.0 approved hours. A Needs Attention table lists thirteen employees with their department, rate, absent, run, late and overtime figures, above a By Department section noting that rate equals present days over working days.
Four headline tiles, then the people behind them. Each tile carries its own qualifier in small type.
Four report tiles: Attendance Rate 27 per cent with the note 13 employees, Absent Days 0 with the note across the period, Late Arrivals 5 with the note earliest check-in only, and Overtime 0.0 with the note approved hours.
Read the small grey line under each figure. Late Arrivals counts earliest check-in only, and Overtime counts approved hours only.
Tiles on the Attendance report
FieldWhat it does
Attendance RatePresent days over working days, across everybody at the depot. The formula is printed on the By Department section.
Absent DaysWorking days with no record and no approved leave, added up across the period.
Late ArrivalsCounted from the earliest check-in only, so a second entry on the same day does not count twice.
OvertimeApproved hours. Overtime somebody worked without an approved request is not in this figure.

Needs Attention

The Needs Attention table on the Attendance report, with a Sort control set to Most absent. Columns read Employee, Department, Rate, Absent, Run, Late and OT. Thirteen employees are listed, each with a red 27.3 per cent rate, zero absences, a dash under Run, and late counts of zero, one or two.
Sorted by Most absent by default. Each name opens that person's Employee Report for the same period.
Columns on Needs Attention
FieldWhat it does
RateThat person's own present-over-working-days figure, shown in red when it is below expectation.
AbsentDays absent in the period.
RunThe longest consecutive run of absence, which distinguishes a scattered week from a solid one.
LateLate arrivals in the period.
OTApproved overtime hours.

Employee Report, one person

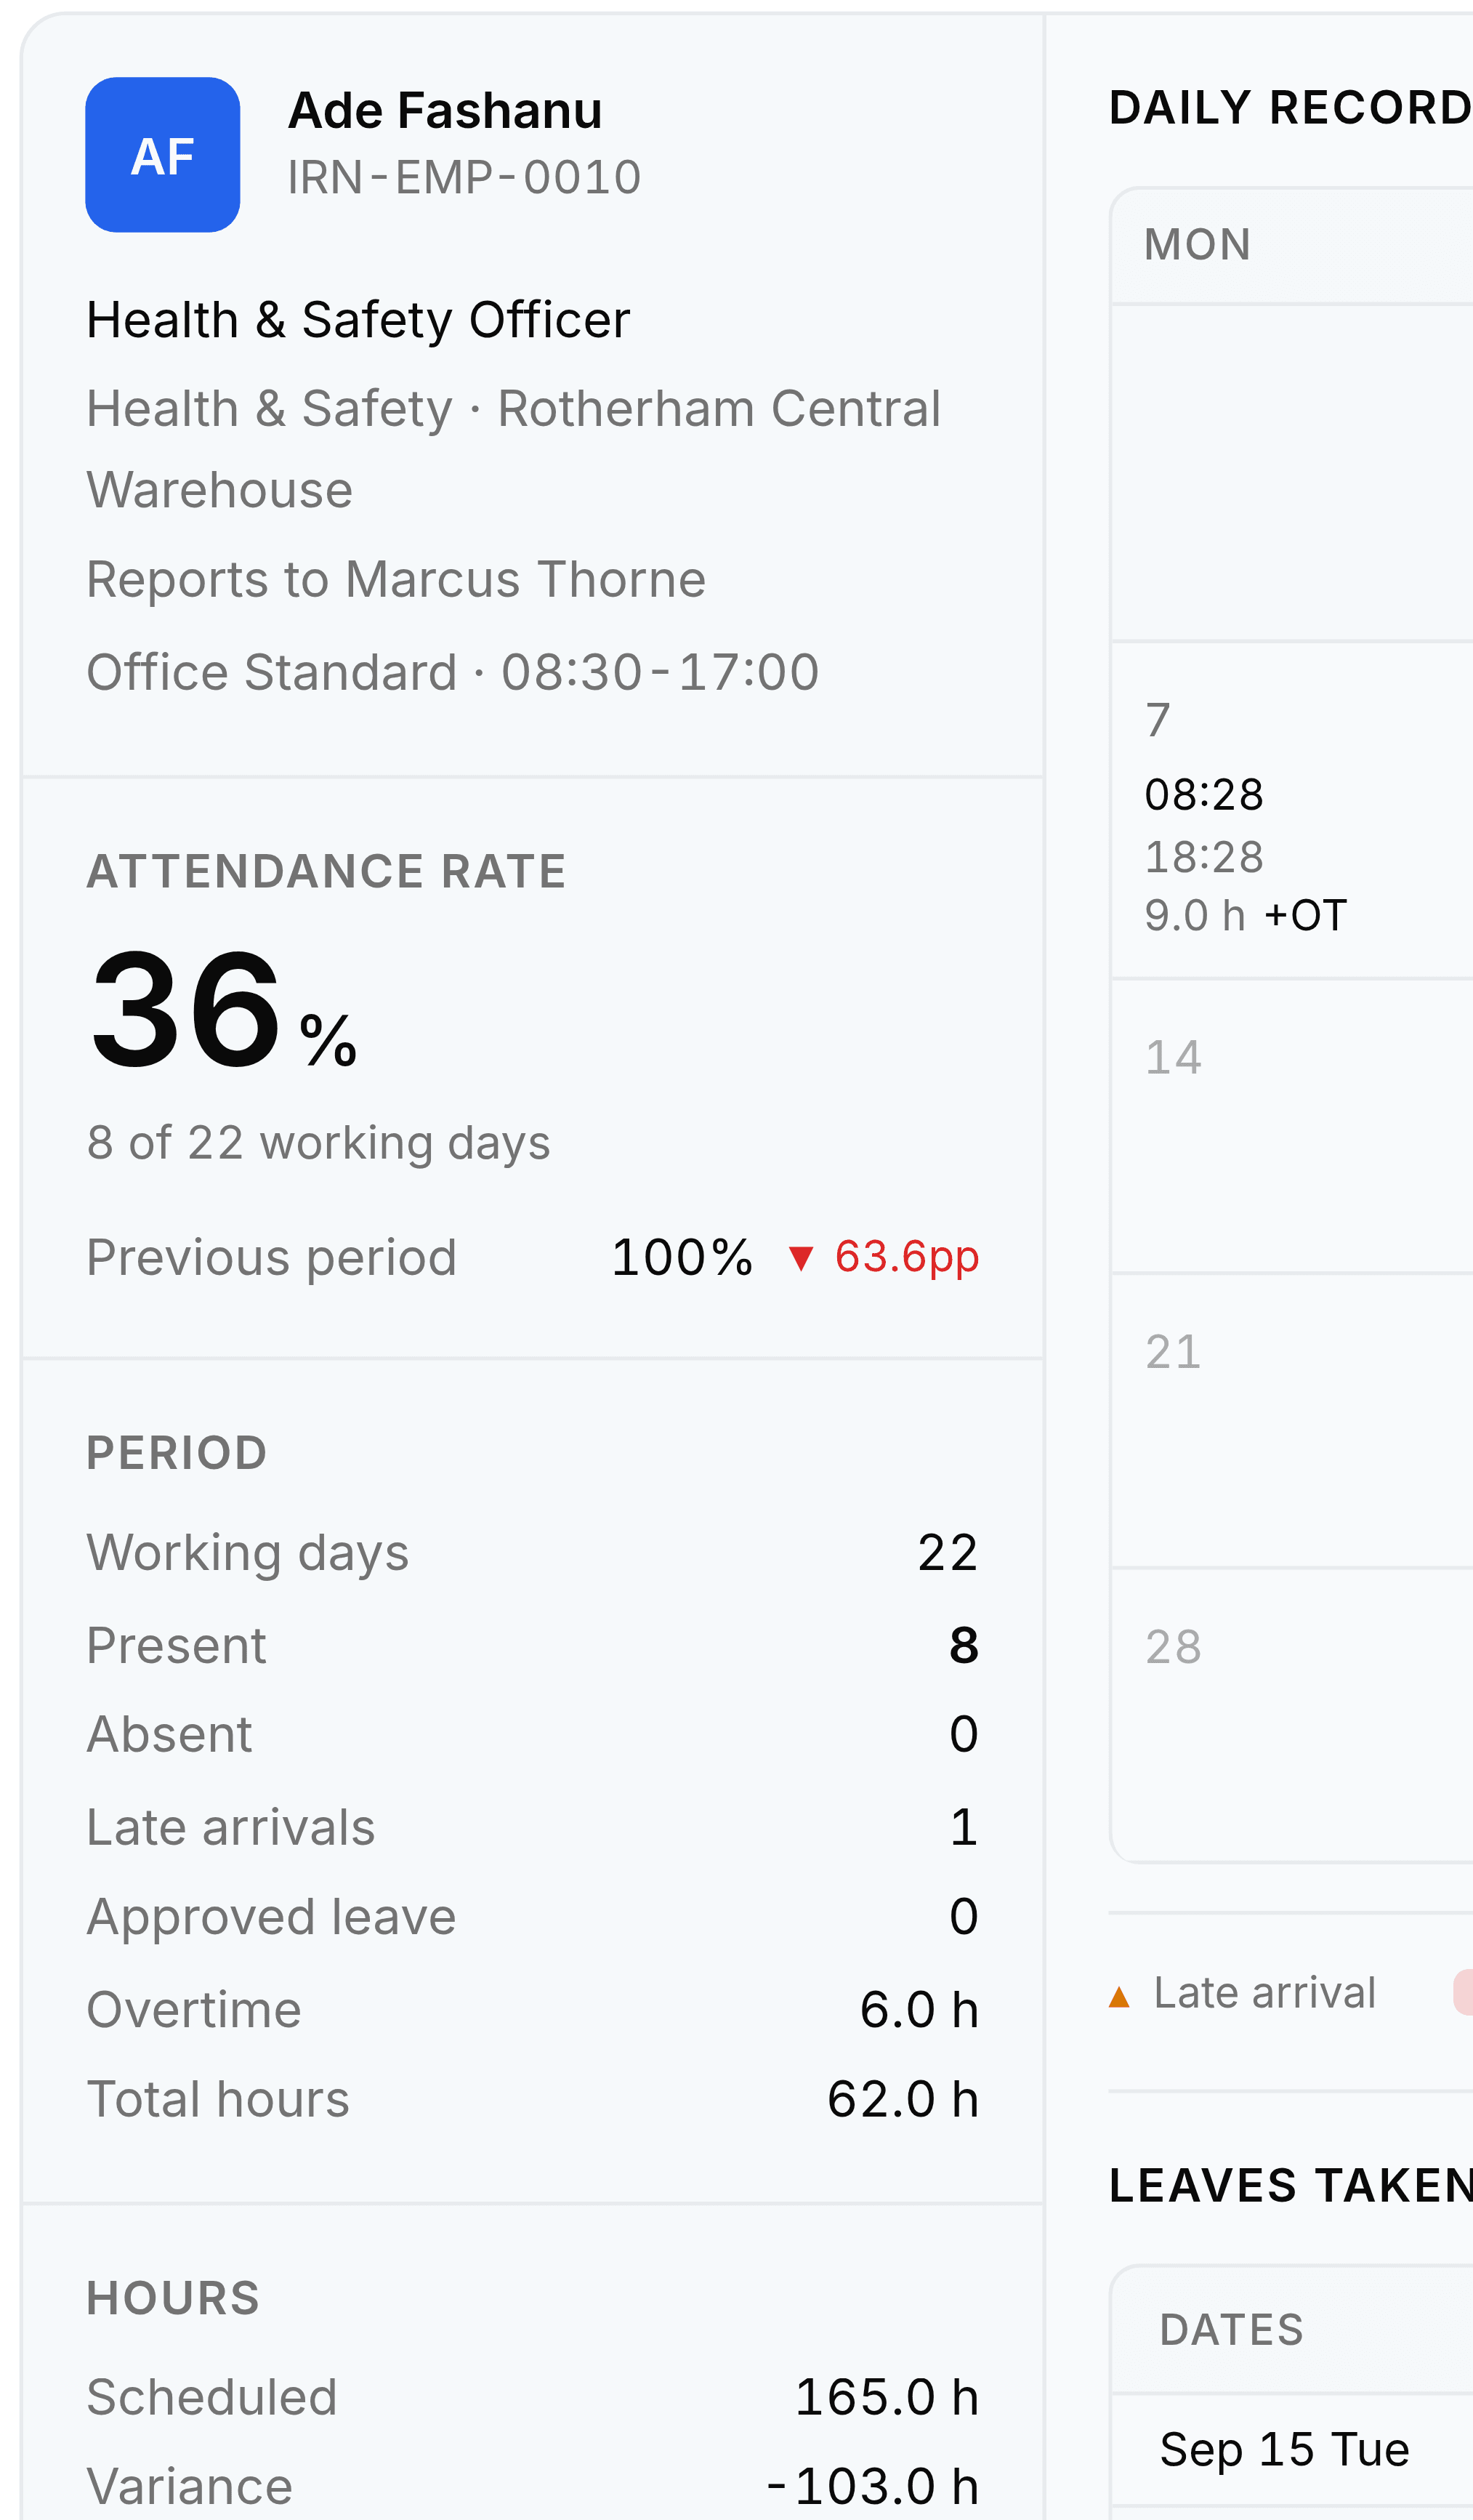
The left rail of the Employee Report for Ade Fashanu, reference IRN-EMP-0010, Health and Safety Officer at Rotherham Central Warehouse, reporting to Marcus Thorne on the Office Standard shift from 08:30 to 17:00. An attendance rate of 27 per cent covers 6 of 22 working days, with the previous period at 100 per cent and a fall of 72.7 percentage points. Period totals read Working days 22, Present 6, Absent 0, Late arrivals 1, Approved leave 0, Overtime 5.0 hours and Total hours 53.0 hours. An Hours section reads Scheduled 165.0 hours and Variance minus 112.0 hours.
The rail is the whole period in one column, including a comparison against the period before it.

The daily record

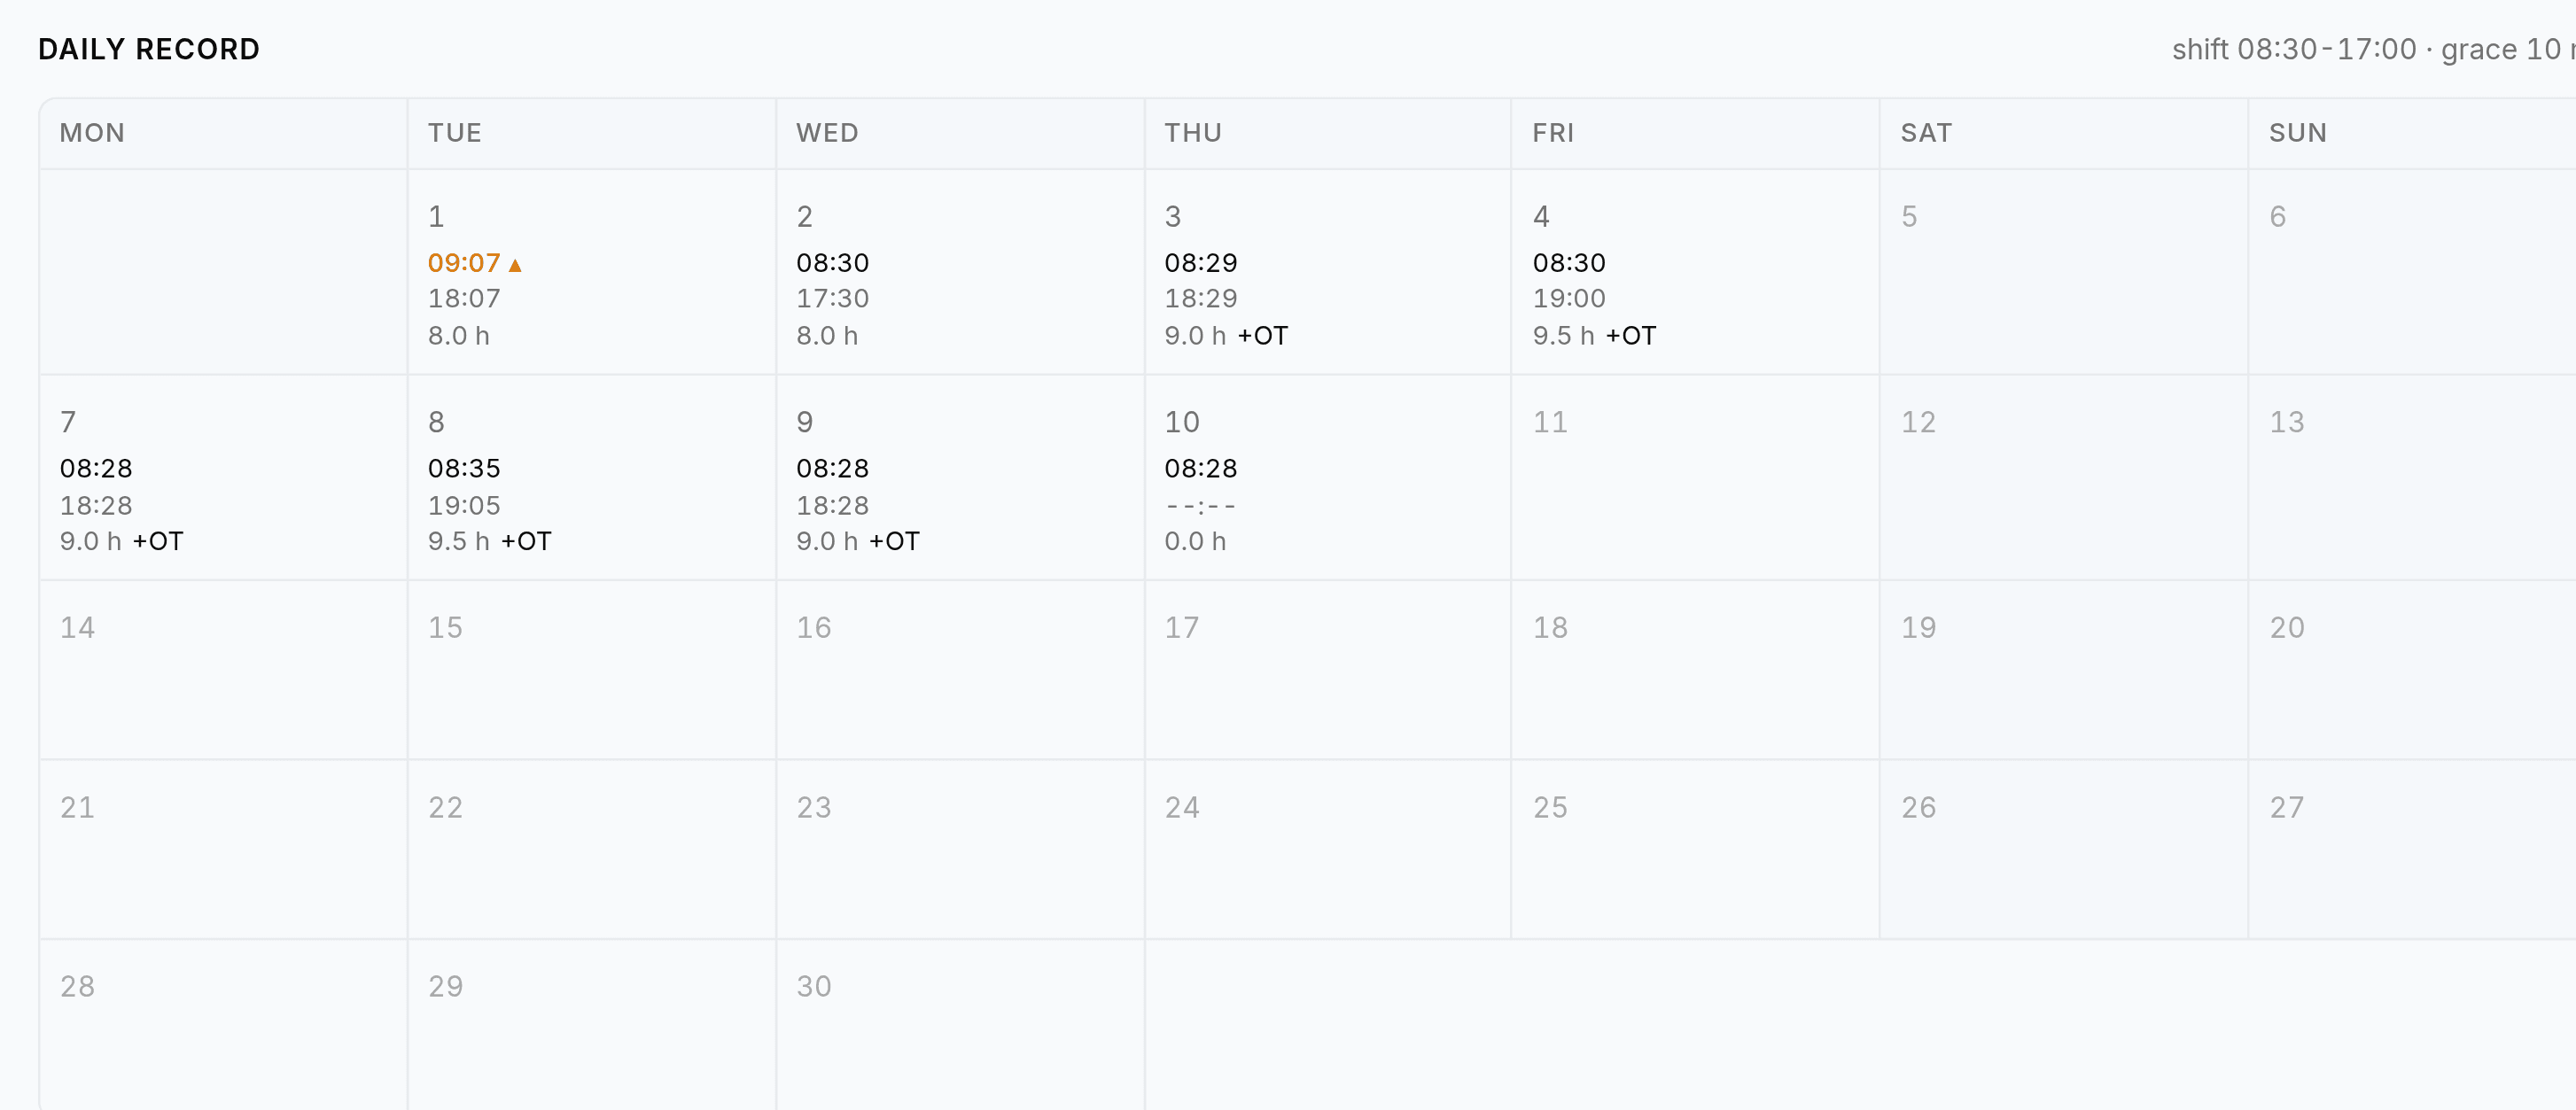
The Daily Record calendar on the Employee Report, headed with shift 08:30 to 17:00 and grace 10 min. Weekday columns run Monday to Sunday. The first day shows 09:07 marked with a triangle, then 18:07 and 8.0 hours. Other days show check-in and check-out times with hours and a plus OT marker. A legend below reads Late arrival, Absent, Leave, Holiday or weekly off, and plus OT Overtime.
Note the header: the shift and its grace period are printed here, which is the only report that shows them.

Was this document helpful?