
Run a report
Opening a report, setting the period it covers, and narrowing it to the rows you actually meant.
Every report opens the same way and carries the same toolbar, so learning one is learning all twenty-seven. The only thing that varies is which controls a particular report offers.
Highlights
- A report opens already run, using its default period.
- The date range is the control that matters most, and it holds ten presets.
- Run Report re-reads the data after you change anything.
- Columns are sortable, and a totals row sits under the last one.
- Not every report offers every control.
The toolbar
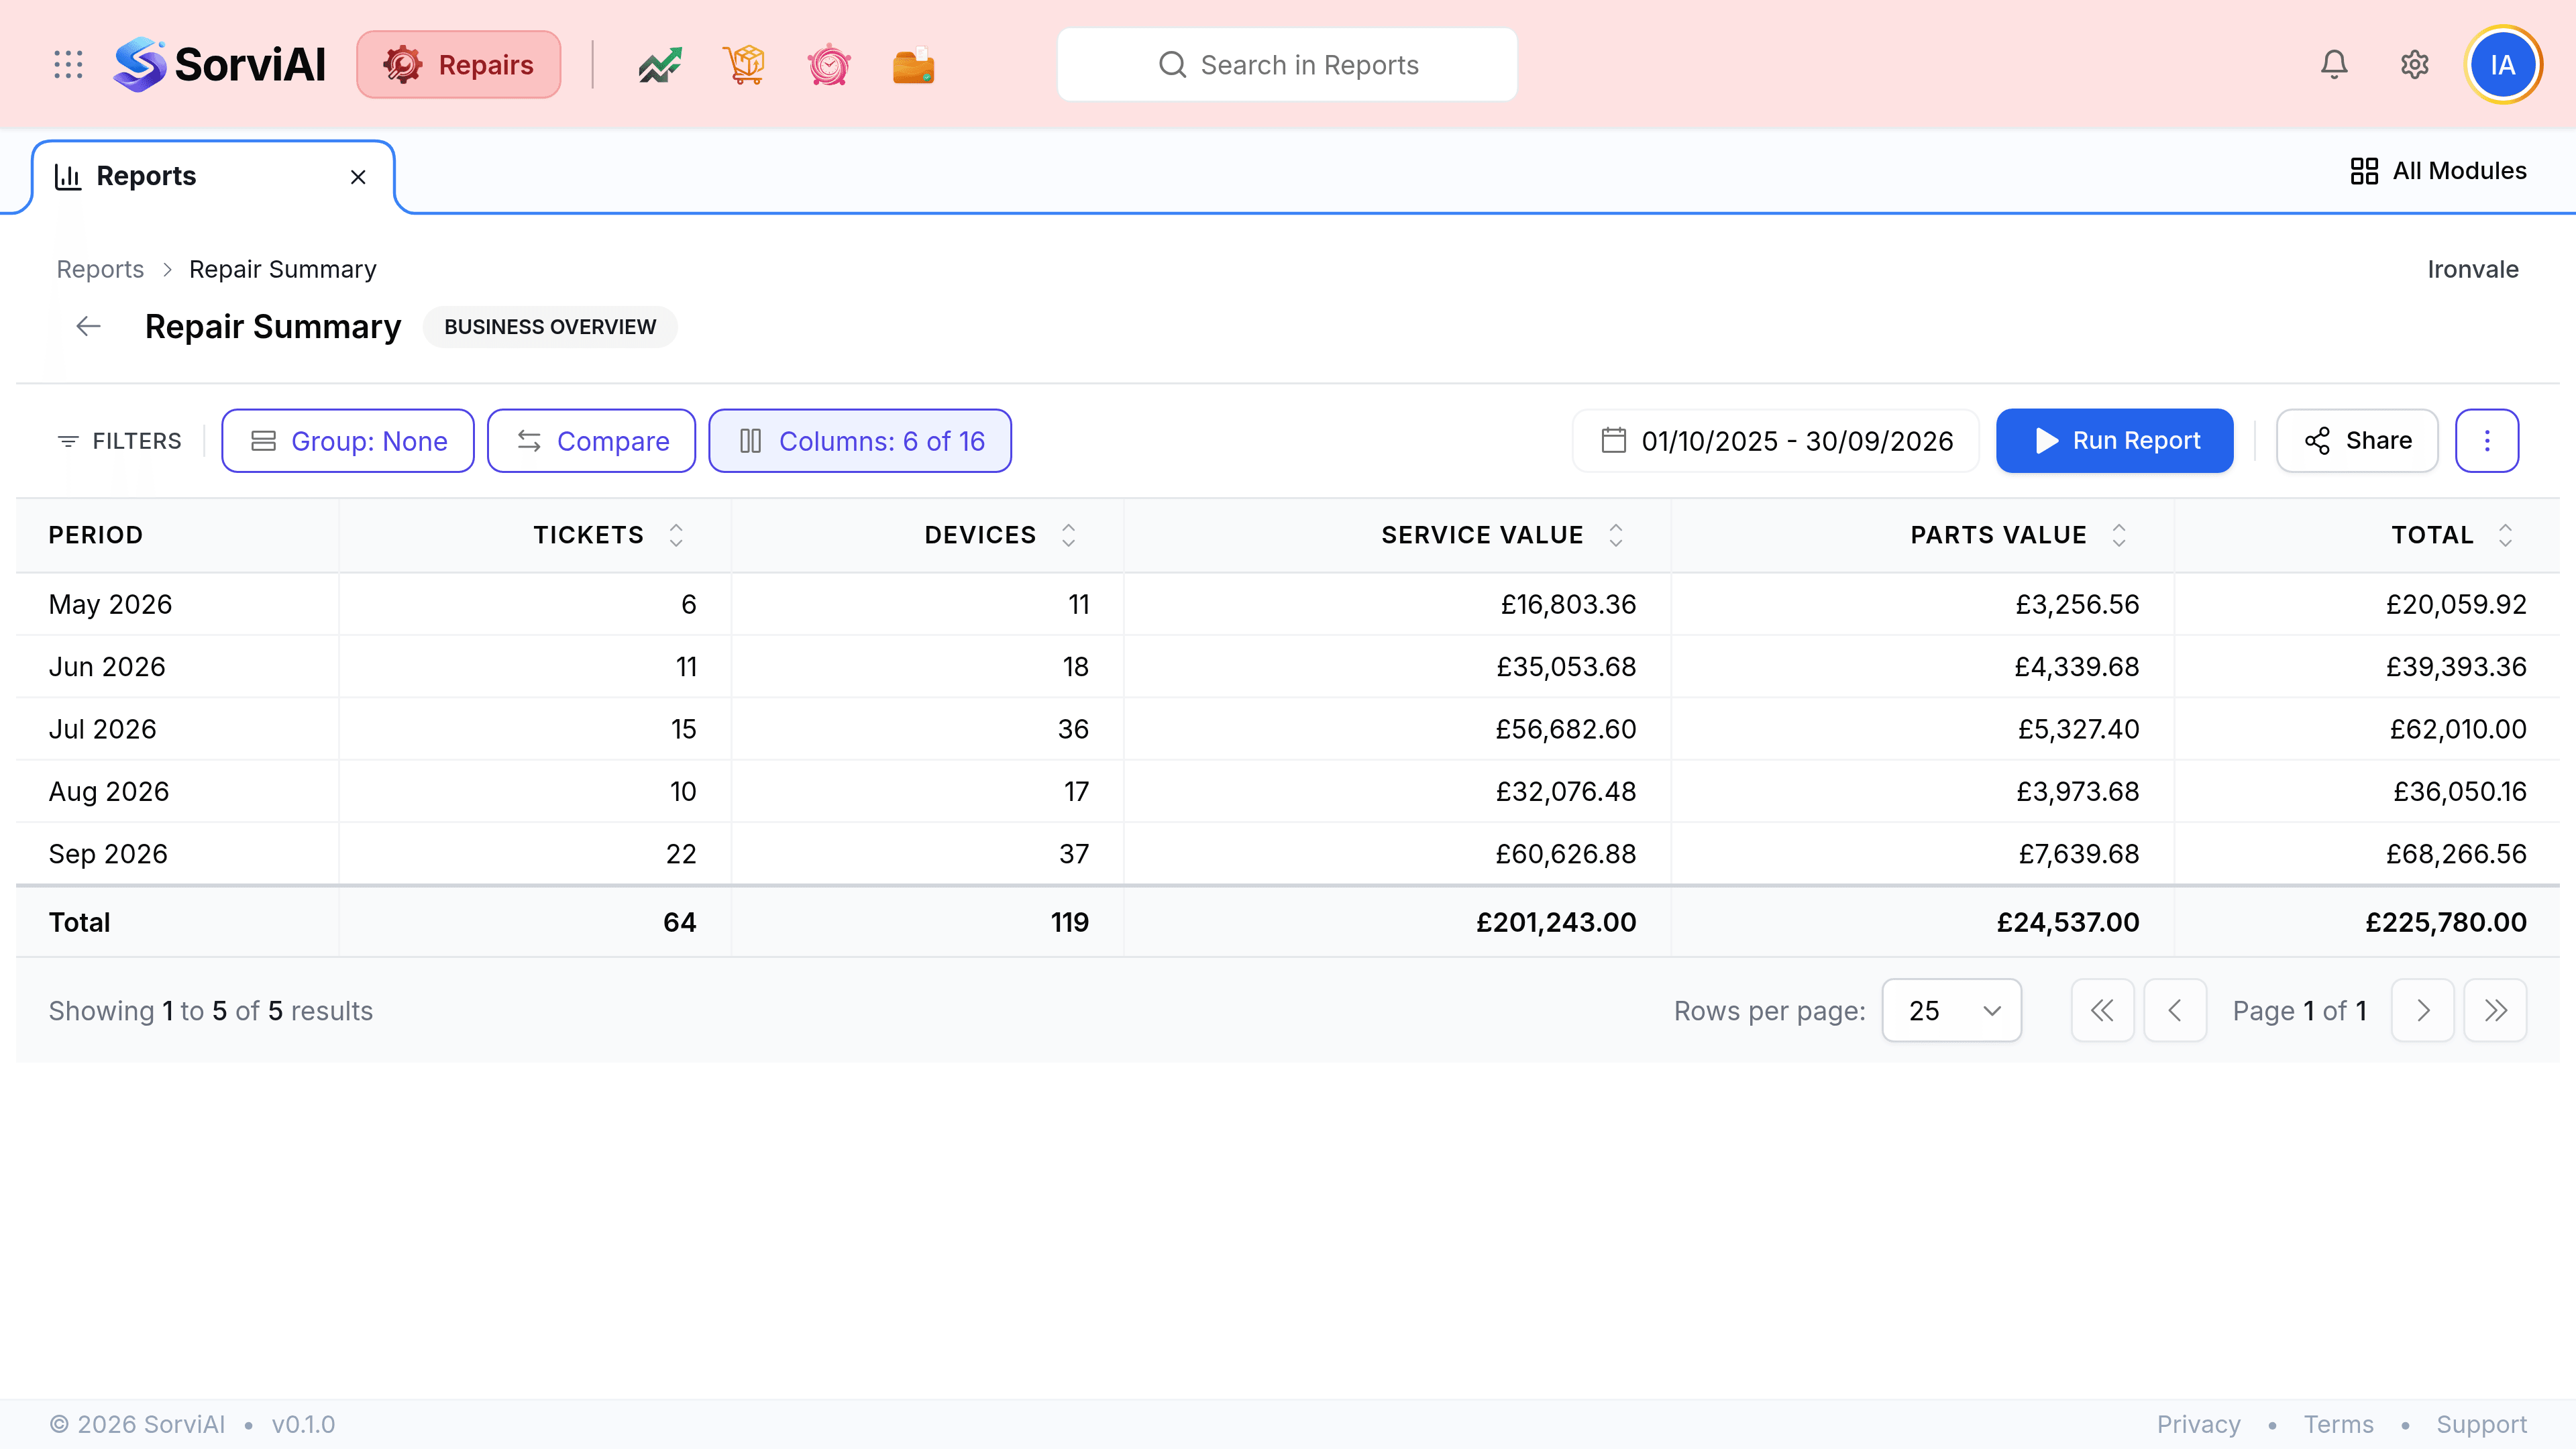
- Group
- Rolls the rows up by a field, so a list of jobs becomes a count per month or per technician. Only on reports where grouping makes sense.
- Compare
- Puts a second period alongside the first, which is how you see whether a figure is going the right way.
- Columns
- Adds and removes columns. Useful for taking a wide report down to the three columns you meant to look at.
- The date range
- The window the report covers. It carries the report's default until you change it.
- Run Report
- Re-reads the data with whatever you have set.
Set the period
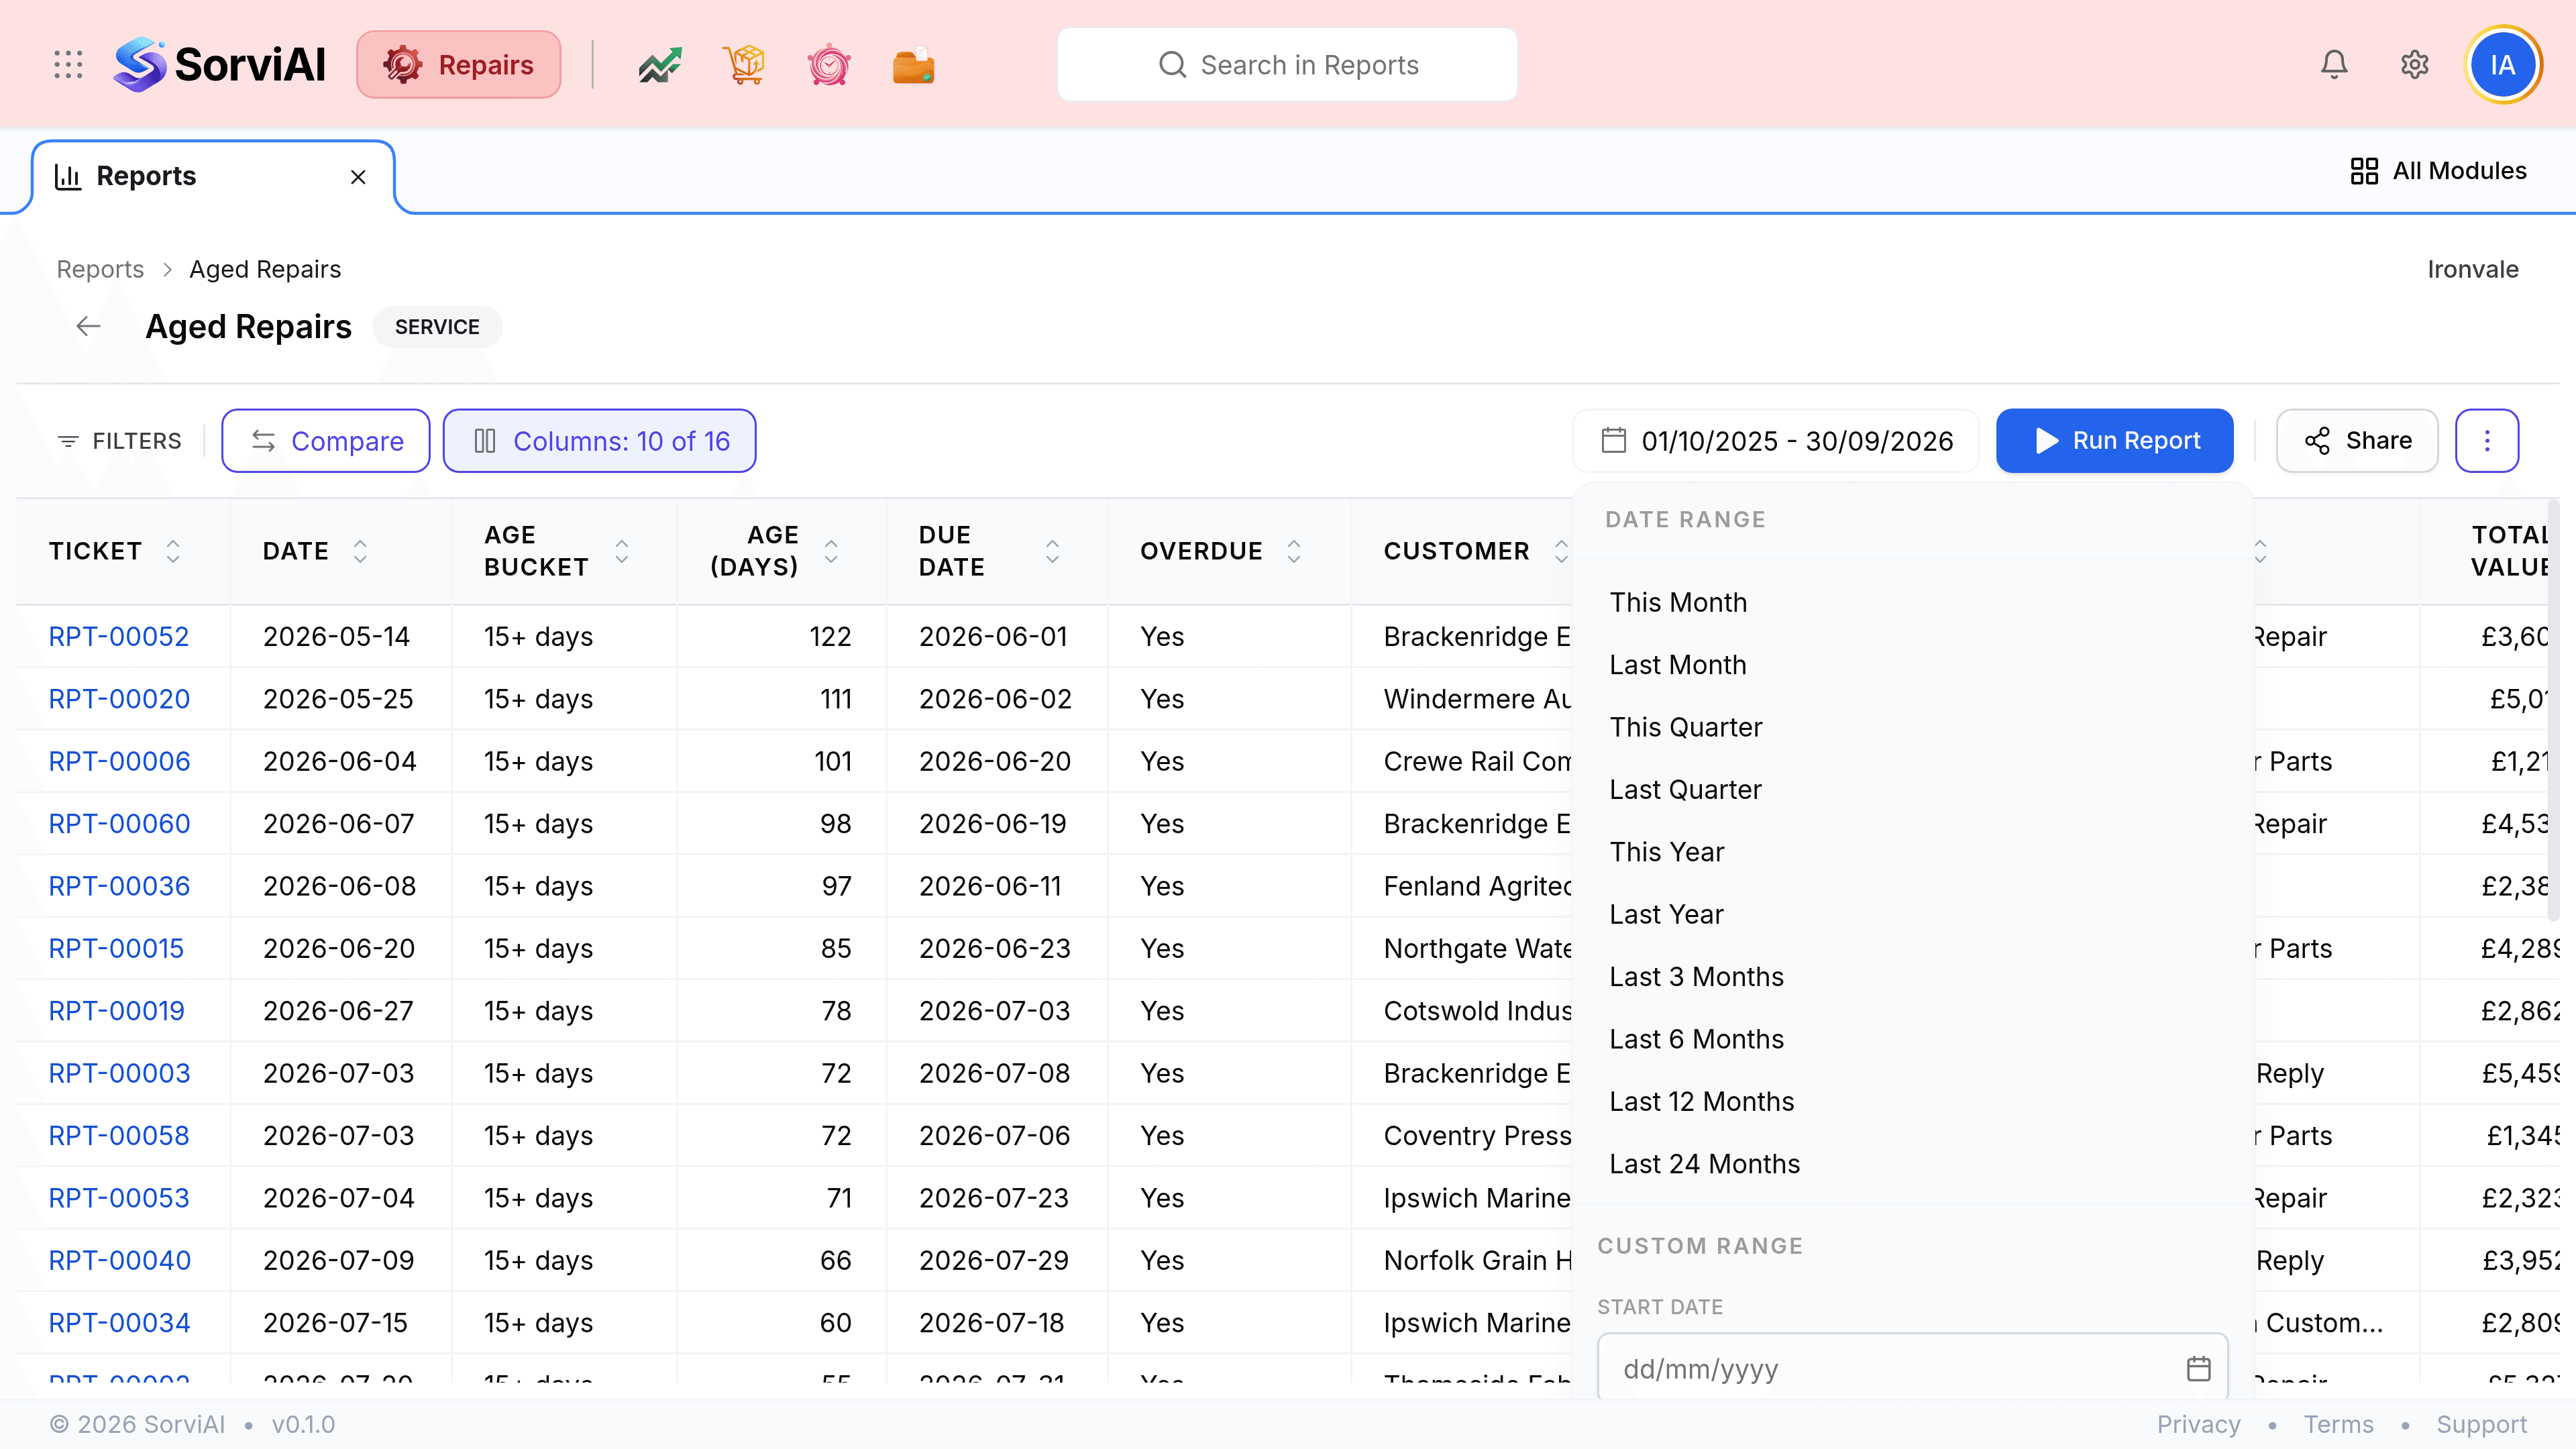
Go to Reports and open the report you want
Use the category chips or the search box to find it.
Select the date range and choose a period
Pick a preset, or enter a start and end date under Custom Range and select Apply.
Narrow the columns if the report is wide
Columns turns off anything you are not reading, which matters more once you export it.
Select Run Report
The table re-reads with your settings.
Sort by selecting a column heading
Most reports open sorted sensibly already, oldest first on an ageing report and largest first on a value one.