
Reading the widgets
What each widget on the Repairs overview counts, and the traps in comparing one against another.
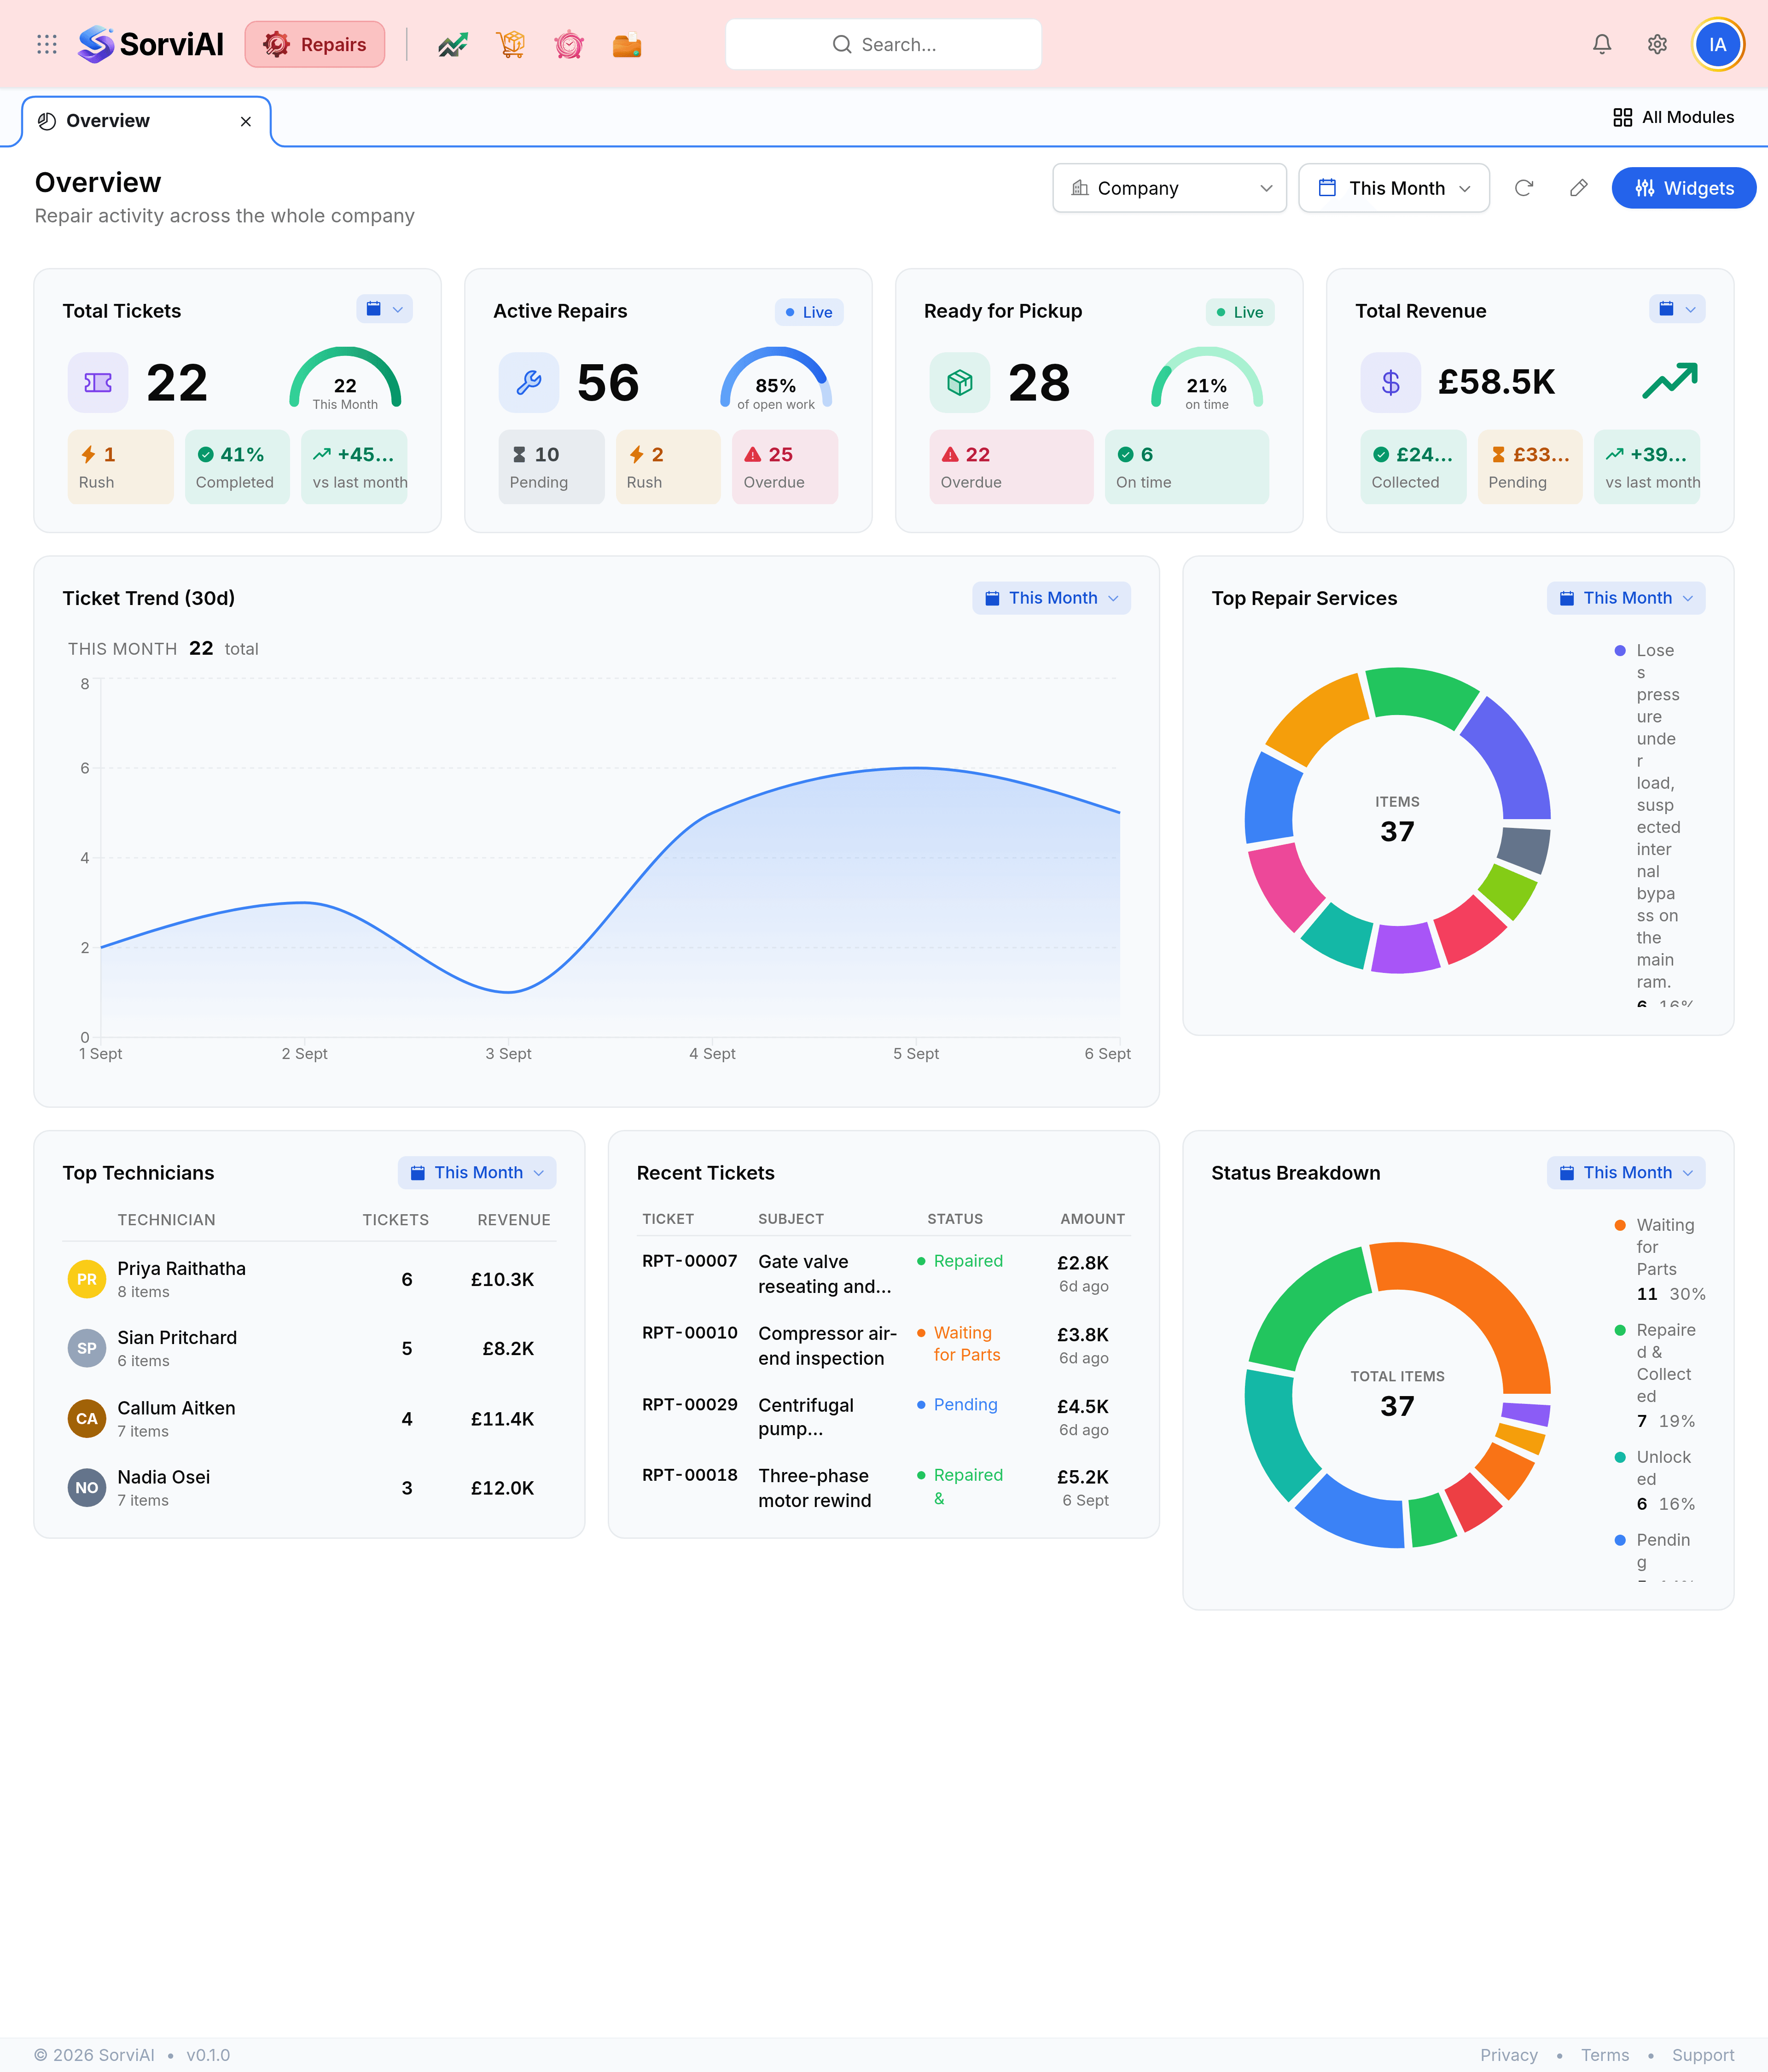
Nine widgets ship on the default board. Each answers a different question, and two of them count something other than tickets, which is the thing most worth knowing before you read a figure aloud in a meeting.
The four counts across the top

| Field | What it does |
|---|---|
| Total Tickets | Tickets raised in the chosen period, with how many are rush jobs, what share is finished, and how the period compares with the one before it. |
| Active Repairs | Repairs currently being worked on, as a share of all open work. It is live, so it counts what is open now rather than what was raised this month. |
| Ready for Pickup | Repaired equipment waiting to be collected, split into what is on time and what is overdue. Also live. |
| Total Revenue | What the period billed, split into collected and still outstanding, with the change against the previous period. |
The charts
- Ticket Trend (30d)
- Daily ticket volume across the last thirty days, with the period total called out above the chart. Read it for shape rather than for exact counts: a dip on a Sunday is not a problem.
- Top Repair Services
- Which faults you see most, as a share of the work. The number in the middle of the ring is a count of line items, not of tickets.
- Status Breakdown
- Where the work is sitting, by status. Also counted in line items, and the fastest way to see that a third of the workshop is waiting on parts.
The lists below the fold
| Widget | What it answers |
|---|---|
| Top Technicians | Who handled how many jobs, and what those jobs were worth |
| Recent Tickets | What has come in lately, with its status and its value |
| Status Breakdown | Where the work is stuck, as a share of everything open |